Thursday, March 27, 2014

Systematic Errors Yes and No

Does my data contain systematic errors?  You bet, it does.

Do those systematic errors make the data useless?  Not in the least.

The systematic errors are contributing to the overall error, but when the overall error is 2 - 4 percent, I'm not going to worry about them too much.

I spent all of yesterday looking at these errors and, while they're annoying, they appear to be in the raw data which means nothing I can do on the software end is going to change that.  I'm not going to try to explain to my readers what I'm seeing, because unless you've been looking at all of my data as much as I have, you probably won't see it.  However, this is the kind of plot I was looking at all day:

Figure 1: Photometry data from 23 Mar 2014 UTC

Now I guess that might look a bit scattered.  Staring at it a while will allow you to start seeing some patterns.  See them?  But consider the scale on the y-axis, plus the overall scale of the data (zero to 65535).  When I do this, I realize that the data in Figure 1 has an error of 2.18%.  This is well within my tolerances as far as having confidence that I'll be able to see variations in the lightcurves as these moons orbit Jupiter.

So now I can say, for the first time in this project, that I'm confident about the data that I have.  It seems consistent to a very reasonable tolerance.

I now, therefore, move on to more important matters.

Photometry versus Phase Angle

What I'm slowly moving towards is being able to plot phase angle versus photometric value.  When I do this, I should see variations similar to those shown in those USGS plots I did on a previous post.

To calculate the phase angle, I need to know three pieces of information:

  • The distance from the target to Jupiter
  • The direction of motion of the target (toward or away from Jupiter)
  • The side that the target is on (east or west of Jupiter)

I've created a little parameter file that will contain data used for this calculation (as well as the data needed to calculate the airmass of the observations -- needed to correct for atmospheric extinction).  In this case, the data is the distance (in AU) to Jupiter.  I need this in order to properly calculate the radius of the orbits for each moon in pixels.

The phase angle is then defined:

cos (phase angle) = measured distance / radius

I also need to know what "quadrant" the moon is in, and the direction of motion and the side tells me that:

Quad 1: east moving away
Quad 2: east moving toward
Quad 3: west moving away
Quad 4: west moving toward

So with all of this info, I can calculate the phase angle, which of course will go from zero to 360 degrees.  I've decided to define zero degrees as the point in the orbit when the moon is directly behind Jupiter and moving east.  This is an arbitrary definition and I'm not sure if it's the standard definition.  Once I find out what that is, it's likely I'll have to change mine to fit the accepted geometry.  No biggie.  The parameter file I mentioned above will also contain this information.

"Lost" Data

The other problem I'm trying to figure out is that a lot of data is "lost" because Jupiter is out of the field and therefore I can't compute a distance.  I've got an idea about how to deal with this and I'm hoping to try that out sometime very soon.  Callisto will especially suffer from this since it almost always is going to appear pretty far from Jupiter.  But as I said, I've got a possible solution and I'll see if that helps in any way to at least give me a way of looking at all of the data even though it may not be as exact as I would like it.

Data Reduction

I still have a backlog of new data to reduce.  I also need to go back and re-reduce all of my old data so I can start looking at this phase angle stuff.  Once I get the phase angle code running, I look forward to plotting all of this data to start looking for photometric variations.

Tuesday, March 25, 2014

Asteroid Data Hunter, Backlog Jupiter Data, Relative Photometry, Things To Do

Asteroid Data Hunter

I'm still sorta recovering from my marathon session creating my entry for the Asteroid Data Hunter competition.  I should know the results of the reviews later today.  I'm having very strong doubts that my proposal is "good enough", but that decision is out of my hands.  I look forward to seeing all the other entries.

This is a pretty big deal if I win, but for now I'm keeping my excitement to a minimum.

Backlog Jupiter Data

Wow -- I have a backlog of data that I still need to reduce and get prelim analysis.  Never thought I'd be saying such a thing for my own data.  It's just plain old work to reduce data.  Just gotta do it, that's all.

I've modified my data collection technique in that now I'm taking 300 images per "set" rather than 200.  While 846/1800 (48%) images actually have Jupiter in them, because of the geometry of the moons (Callisto being pretty far away), I'd say that something like 85% of the images have SOMETHING in them of value.  So that's something around 1500 new data points.

I'm pretty excited about these last couple of data sets since they contain my first known observations of eclipses.  The one involving Callisto ingress into eclipse on 20 Mar 2014 caught me totally by surprise.  The session from 23 Mar 2014 has an Io egress out of eclipse.   I look forward to plotting each of those light curves to see when and how these events occurred.  I need to go back though all of my data now to see if I've already recorded one of these events without knowing it.

Here are pics of the Io egress event:

Figure 1: Io egress event

The times for these images are:

Upper left: 05:22:04 UTC
Upper right: 05:22:27 UTC
Lower left: 05:24:02 UTC

I'd say my timing error is probably +/- 2 seconds but I'll have to compare the internal clock with the WWV to be certain.

Using the predictions from this site, I note that the time of this event is 05:24:54.  So I see that my timing is off by about three minutes (three minutes early).  Not sure why.  I need to check my internal clock on the computer but I doubt it's drifted that much in just a month.  I also don't know what this 05:24:54 time is -- if it's for the start of the egress, the end of the egress, or the middle.  All I can say at this point is that it appeared fairly suddenly over the course of about one or two minutes.  If my timings are correct, then I'd say that the time from IMCEE is the time of the END of the event (when Io reaches its nominal magnitude and is totally out of the shadow of Jupiter).

I guess there's nothing else I should really do until I get the atmospheric extinction stuff built into the code.  This requires me writing some software that'll do least-squares fitting to a polynomial of an arbitrary order.  I want to write a general fitting piece of software like this so I don't have to come back later an expand on just a simple linear fit.  This requires dusting off some old books and reminding myself how to compute things like determinants and cofactors.  Ah, mathematics.  So really, until I have some working code to do this kind of thin, there's no point in running through the data.  The data will be there and continue to collect it.  Tonight looks like it's gonna be a good night with Io at max elongation and Callisto and Ganymede in nice positions.  Europa is gonna be heading closer to Jupiter, so I'm likely not going to get anything useful outta her.

Relative Photometry

I was staring at a background star the other night in the same FOV as the Jupiter system and remarked to myself that I could be doing relative photometry of each moon with that star.  I can assume for the time being (until I find out what star this is) that the star maintained a constant brightness over the period of the session.  This means I can compute the ratio (of the difference) between the background star and the moons to see how they vary in brightness over time.  This kind of measurement mostly eliminates the need for extinction correction.  But it also pretty much eliminates all the noise from the system, leaving just the raw photometry.

Things To Do

Gadzooks!  So what first?  Do the extinction software work, or focus on relative photometry?  I guess I'm leaning more towards the latter because it probably involves a bit less work.  Linear algebra was never my strong point, although as I recall it was easy to encode.  I'll work on both today, for sure.  Just not sure which one first.  Probably the relative photometry part.

I've also started looking at geometry.  What I need to start doing asap is creating phase plots.  In order to do this, I need to know where in its orbit each of these moons are.  The three pieces of information I have about that is location, distance, and direction of motion.  Phase plots are likely the best way I can visualize any kind of variations in brightness.  The jury is still out on whether or not I'm seeing variations in brightness, but that'll come when I look at more data and put several sessions together (which I'm about able to do!).

Much to do and I'll have an update (hopefully) sometime later today.  For now I'm just trying to distract my brain from just focusing on the Asteroid Data Hunter results.

Thursday, March 20, 2014

Callisto Eclipse, Asteroid Data Hunter

A surprise event happened during last night's session: Callisto was eclipsed by the shadow of Jupiter -- and I watched it happen.  Very cool.


Going....

Jupiter system 04:18 20 Mar 2014 UTC

Going ....

Jupiter system 04:27 20 Mar 2014 UTC

Gone!

Jupiter system 04:32 20 Mar 2014

More info in this to come in later posts.

At the moment, I'm busy working on my entry for the first phase of the Asteroid Data Hunter challenge.

Monday, March 17, 2014

Data From Yesterday Looks Good

Glancing at some images from last night's session has me anxious to reduce the data and look at the results.  I've reserve any expectations because sofar I've been surprised every time.  The seeing was great and I got probably the best focus sofar. 

I collected 1600 images in total.  841 of those images had Jupiter in them.  Looking at individual image statistics, I calculate that about 1141 images had at least one target.  So that's an efficiency of 71.25%.  Not bad at all.  I look forward to the day when I don't have to measure "observing efficiency".

Here's a sample of the data:

Figure 1: The Jupiter system as seem from Earth at 17 Mar 2014 03:30:24 UTC

Wednesday, March 12, 2014

First Look 11 Mar 2014 Data

There were eight sets of 200 images taken on 11 Mar 2014 UTC and I've run them through reductions and gotten some data back to start looking at.

The distance measurements (astrometry) looks really nice:

Figure 1: UT time (x-axis) versus Distance (y-axis)
The red marks are Io, the green are Europa, and the blue are Ganymede.  As you can see, Ganymede was moving slightly away, Europa was moving slightly away, and Io was moving closer over the course of the session.  It turns out that both Europa and Ganymede were at their furthest elongation and were both pretty stable the entire observing session.

Now I look at the photometry two different ways.  The first is distance versus photometric value:


Figure 2: Distance (x-axis) versus Photometry (y-axis)
And then also look at photometry versus time:

Figure 3: UT time (x-axis) versus Photometry (y-axis)

So why are all the targets getting fainter over time?  My guess is that it's atmospheric extinction, which I haven't taken into account yet.  That will be one of my next tasks.  In order to calculate and compensate for extinction, I need to know the hour angle of the target, which means I need to know the local sidereal time.  At the moment, that information isn't stored in the data header.  I'm hoping that I can in the future.  So for now, I'll have to pretty much manually do it all.  Ugh.  In any case, I'll get that going in the next couple of days and hopefully that'll correct that problem.

But there is another effect I'm seeing.  As time goes by, the photometry is "spreading out" -- it's getting worse.  It's happening to all of the targets so it isn't a spacial effect.  I'm not quite sure what is causing this, yet.  I'll need to look at the data and do some comparisons between images near the beginning of the session and at the end of the session to see if I can see any differences.  My first guess is that the PSF is changing (partially due to airmass, but also maybe something else?  Focus maybe?) and that's having an effect on the photometry.  Just gotta look and look and look and try things until I figure it out.

Also, the flux ratios aren't what's expected given the published magnitudes.  I need to get some hard numbers on that and then figure out why I'm seeing differences with these.  Io should be 1.28 times the flux of Europa, and I'm getting something around 1.53.  The flux ratio between Io and Ganymede should be 0.68 and I'm getting 0.87.  My initial guess as to why there's a difference is that my aperture photometer isn't large enough to be letting in all the light.

I'm also seeing some systematics in the finer details as well, but I haven't figured out a way to show it on this blog.  For now all I can say is that as the targets track through the field of view, the photometry is brighter at the beginning and dims until the target is out of the FOV.  I'm thinking that this might be due to the brightness of Jupiter bleeding into the target photometry, but I need to look at individual images to see if that's the case.  I might be able to eliminate that with a simple sky subtraction before I make the photometric measurement.

So much to do and I'm letting the data guide me.


USGS Maps and Flux

So before I get too far into this project, I wanted to do a sanity check on basic fluxes coming from these moons to see if I've got any chance in seeing variations.

I took a map of Ganymede from the USGS website.

I then created an image that contained 2/3 of the latitudes and all of the longitudes.

I created a rectangle that contained 2/3 of the latitudes and half the longitudes.  This represents the half of the moon that I can see at any particular phase in its orbit around Jupiter.

I then summed up the pixel values in this rectangle and went all the way around the moon summing and slowly moving the rectangle one degree at a time.

The results are as follows:

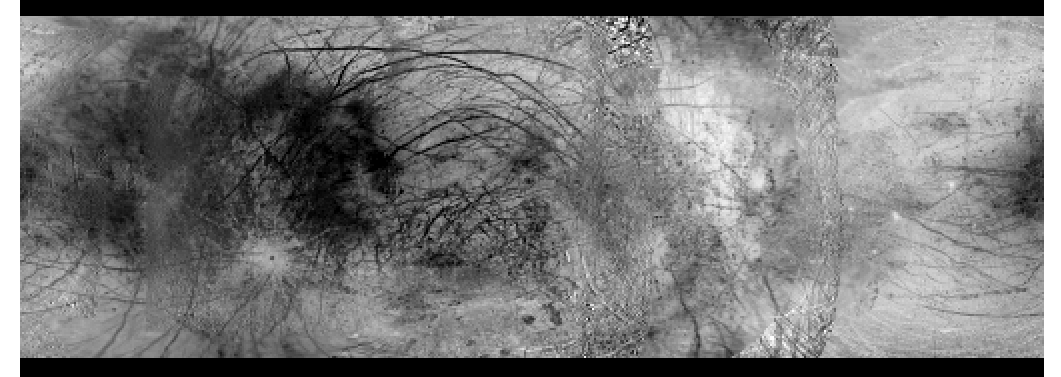
Here is the original full image of Ganymede showing 2/3 of latitudes and all the longitudes:

Figure 1: Ganymede map from USGS
A plot of the fluxes versus longitude shows this:


Figure 2: Flux (y-axis) versus Longitude (x-axis)
As you can see from the plot there is a variation of overall flux.  This is pretty obvious from the picture, too.  It's darker in the center of the image than on the edges.

But .... how much?

Well, it turns out that the maximum flux difference is 8.7%!  This is well within my (sofar) measuring accuracy of about 4%.

So what this means is that -- at least according to this "official" USGS map of Ganymede -- I should be able to see variations in the flux as this moon orbits Jupiter.

Very cool.  I need to see if I can get similar maps for the other three moons.  Look at the same USGS site, the data doesn't appear to be consistent.

Did the same thing for Io, and got a 5% variation.  Hmmm, that's right down there with my accuracy.


Figure 3: Io.  2/3 latitudes, all longitudes

Figure 4: Same plot as Figure 2 except this is Io
And also for Europa, which shows a huge 16.9% variation in the flux:

Figure 5: USGS map of Europa showing 2/3 latitudes and all longitudes


Figure 6: Flux values

And finally, Callisto:


Figure 7: Same as the others, except this is USGS Callisto

Figure 8: Same as the other plots, but this is Callisto

The Callisto plot is showing a stunning 19.7% variation in the flux.

This is all very good news for my little photometry project.  This tells me that I have a really good chance to at least see variations in brightness.

===== UPDATE =====

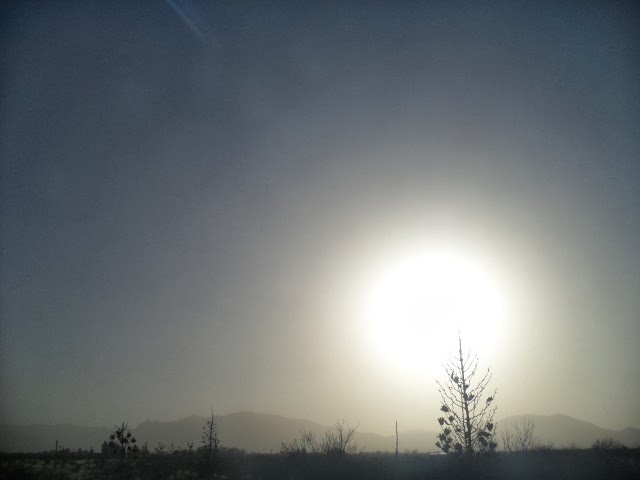
Looks like I might have to cancel tonight's session due to dust.  It's been pretty dusty all day and now at 00:30 UTC it doesn't look like it's letting up.  Dust is at least as bad as clouds when it comes to getting consistent photometry.  Look at that huge halo around the sun!

Figure 9: Lots of dust in the air today means I'm likely to cancel tonight's session

So instead I continue to reduce the data I collected on 11 Mar 2014 UTC.  It's looking really nice (4% photometry) but I'm seeing some systematics that I'm gonna have to look at more closely.  Could be related to sky background.