I took a map of Ganymede from the USGS website.
I then created an image that contained 2/3 of the latitudes and all of the longitudes.
I created a rectangle that contained 2/3 of the latitudes and half the longitudes. This represents the half of the moon that I can see at any particular phase in its orbit around Jupiter.
I then summed up the pixel values in this rectangle and went all the way around the moon summing and slowly moving the rectangle one degree at a time.
The results are as follows:
Here is the original full image of Ganymede showing 2/3 of latitudes and all the longitudes:
 |
| Figure 1: Ganymede map from USGS |
 |
| Figure 2: Flux (y-axis) versus Longitude (x-axis) |
But .... how much?
Well, it turns out that the maximum flux difference is 8.7%! This is well within my (sofar) measuring accuracy of about 4%.
So what this means is that -- at least according to this "official" USGS map of Ganymede -- I should be able to see variations in the flux as this moon orbits Jupiter.
Very cool. I need to see if I can get similar maps for the other three moons. Look at the same USGS site, the data doesn't appear to be consistent.
Did the same thing for Io, and got a 5% variation. Hmmm, that's right down there with my accuracy.
 |
| Figure 3: Io. 2/3 latitudes, all longitudes |
 |
| Figure 4: Same plot as Figure 2 except this is Io |
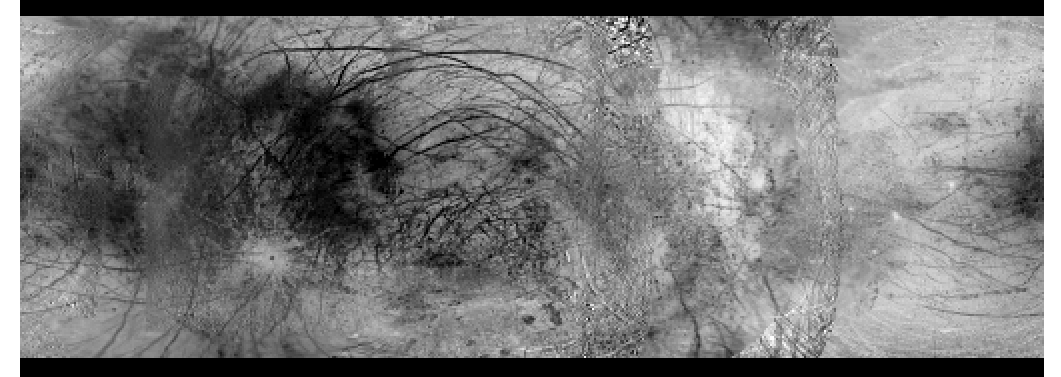 |
| Figure 5: USGS map of Europa showing 2/3 latitudes and all longitudes |
 |
| Figure 6: Flux values |
And finally, Callisto:
 |
| Figure 7: Same as the others, except this is USGS Callisto |
 |
| Figure 8: Same as the other plots, but this is Callisto |
The Callisto plot is showing a stunning 19.7% variation in the flux.
This is all very good news for my little photometry project. This tells me that I have a really good chance to at least see variations in brightness.
===== UPDATE =====
Looks like I might have to cancel tonight's session due to dust. It's been pretty dusty all day and now at 00:30 UTC it doesn't look like it's letting up. Dust is at least as bad as clouds when it comes to getting consistent photometry. Look at that huge halo around the sun!
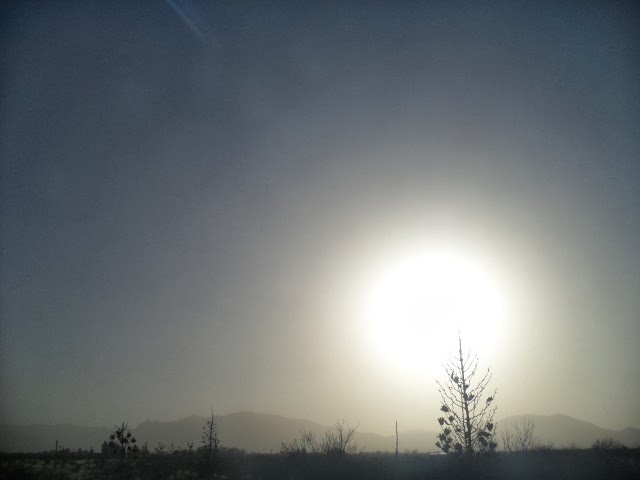 |
| Figure 9: Lots of dust in the air today means I'm likely to cancel tonight's session |
So instead I continue to reduce the data I collected on 11 Mar 2014 UTC. It's looking really nice (4% photometry) but I'm seeing some systematics that I'm gonna have to look at more closely. Could be related to sky background.
No comments:
Post a Comment