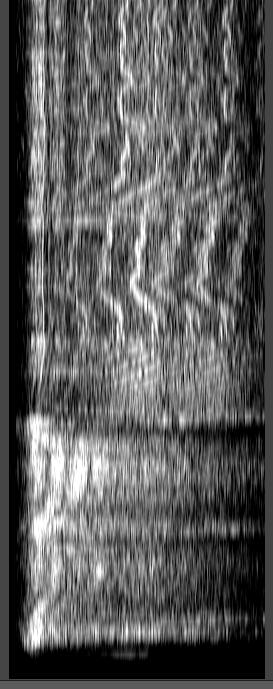
I can't fit the whole thing without making it hard to see, but this is a spectrum of the first ~516 seconds of my latest ride on my ebike. The data is from the accelerometer on a smartphone, measuring x, y, z, and total g-force. The plot above goes from 0Hz (left) to 100 Hz (right), and time goes from bottom to top.
The first third shown here is when I'm on a dirt road, and then the remaining 2/3 is on paved highway. These are very complex spectra and I have no idea how to properly interpret them. The harmonics are pretty amazing!