Saturday, April 26, 2014

Great Photometry

Looked at the data from 17 March 2014 UTC today and found it to be very clean.  Io and Ganymede were making a close approach to one another, so their light is combined in the plot below:

Figure 1: Photometry for 17 March 2014 UTC


In any case, this data looks really nice and I'm happy with the data collection and calibration process.  This data is now what I'd call "fully calibrated" in that the final "reduction" is now complete with respect to atmospheric extinction.  X-axis is the UTC time, and the y-axis is the brightness, in ADU (corrected such that this would be the brightness at the top of the atmosphere).

Wednesday, April 23, 2014

Surprise color, Saturn here I come

What does it mean when the atmospheric extinction is different for each moon of Jupiter?

Figure 1: Linear fit to compute Atmospheric Extinction


It means (as far as I can tell) that I'm seeing COLOR DIFFERENCES between the moons.  Very very cool.

In Figure 1, the x-axis is the sec(Z) value, and the y-axis is the photometric value (in ADUs).  The relationship between these two values is linear with a negative slope (objects get fainter as they get closer to the horizon).  But the fact that there are differences between the slopes for the different moons can only mean that I'm seeing color differences in those moons.

My system is looking through a 'green' filter:


Figure 2: The filter set I use

So what do the differences in color mean?  Well, I can say that moon A is "redder" or "bluer" than moon B.  But what does a larger or smaller slope mean in terms of color?

The atmosphere absorbs blue light more than red light.  So as the object gets lower and lower to the horizon, more blue is lost, which makes the object appear fainter.  What this tells me is that Ganymede is "bluer" than Europa and Io, and Io is slightly "bluer" than Europa.

The larger the negative slope, the "bluer" the object is.  This is a hard one to visualize, so I may have to correct this statement later.

I noticed all of this in some data I was looking at from 01 April 2014 and noticed these differences.  Since I have to go back and run all my data reduction software again on all the data, I figured I'd stop and take a look at this (and other things) to try to work out how I want to proceed with yet another surprise.

There have now been three surprises:
  1. Watching targets move in and out of Jupiter's shadow
  2. Watching targets occult or near-miss (I've seen the latter) each other and (I think) seeing a dimming event caused by targets' "atmosphere".
  3. Seeing the color differences between the targets
What else is in store for me?  I'm open for more suggestions, Mr. Jupiter.

I am GO for Saturn

I'm very excited to start my Saturn observations.  For starters, there are SEVEN moons to monitor, with orbital periods between 22.6 hours (Mimas) and 1903.7 hours (Iapetus).  They are all tidally locked, so I'll get the same sort of "full disk" view every orbit.  But in this case, the entire system is tilted at an angle of 26.73 degrees to the ecliptic (very similar to ours) which means I'm seeing more of one pole at a time.  Very photometrically dynamic, I would think.  We'll see.

Saturn opposition is 10 May 2014 - 16 days.  I found this interesting article about Saturn and most interesting is this:

Another interesting phenomenon to watch out for near opposition is known as the Seeliger effect. Also sometimes referred to as the “opposition surge,” this sudden brightening of the disk and rings is a subtle effect, as the globe of Saturn and all of those tiny little ice crystals reach 100% illumination. This effect can be noted to the naked eye on successive nights around opposition, and will get more prominent towards 2017. Coherent-backscattering of light has also been proposed as a possible explanation of this phenomenon. Perhaps a video sequence capturing this effect is in order for skilled astro-imagers in 2014.

According to the Wikipedia entry on 'Opposition Surge', the variation can be quite noticeable.

Just the distances involved are pretty awesome.  Jupiter is about 700 million km away.  Saturn is 1340 million km away -- nearly twice as far!

Approximate maximum elongations for the moons:

Mim: 28.6 arcsec (11 pixels)
Enc: 36.6 arcsec (14 pixels)
Tet: 45.4 arcsec (17 pixels)
Dio: 58.1 arcsec (22 pixels)
Rhe: 81.2 arcsec (31 pixels)
Tit: 188.2 arcsec (72 pixels)
Iap: 548.5 arcsec (210 pixels)

Some of those might be tough, but we'll see.  I should see the same "surprises" with the Saturn system as I do with Jupiter.

PLUS, there is the planet itself and those nice rings.  Since I'm not saturating, I should be able to track the lightcurve of these, also.

I think the signal-to-noise is going to be ok with a 0.2 second exposure.  I think any longer exposure will ruin my chances of getting photometry on Saturn itself.  So I'll suffer a bit with the S/N.

Here's a plot showing the signal from Iapetus -- one of the fainter ones for sure:


Figure 3: Signal from Iapetus


And here's another plor showing the signal from Titan:


Figure 4: Signal from Titan

Both of these plots, as you can see, are on the same scale.

I've calculated that the S/N for Iapetus and Titan are 14.7 and 41.5 respectively.  Anything over 10 is good enough for me, but it will be challenging and I'm anxious to see how noisy this data is.

All of this is very preliminary as I collect more data.  I only took 100 images the other evening, and many of those will be garbage.  So at this point I'd guess that I've got maybe 50 data points on this stuff.  More data required to see how it's going to all work out.  As usual, I'll let the data guide me.

Monday, April 21, 2014

More great data and a surprise

I had two nice sessions in the past week -- last 15 April 2014 and yesterday evening 21 April 2014.  Here's a pic from last night:

Figure 1: The Jupiter system 03:25 UTC 21 April 2014
I have a LOT to talk about, but I've been otherwise occupied so a detailed update will continue to have to wait.

The surprise is that I'm very close to deciding that the Saturn system will be my next target.  My expectations were that I might be able to see Titan, but what I actually was able to see blew me away.  Take a look:


Figure 2: Saturn 05:39 UTC 21 April 2014
Iapetus!

Figure 3: The Saturn system 05:39 UTC 21 April 2014
Titan, Rhea, Tethys, and Dione:

Figure 4: The Saturn system
So -- should I start working with the Saturn system?  I probably will.  I need to look carefully at the signal to noise and also see if I can increase the camera exposure time by a little bit to help.

But, at this point it looks like I'll probably start looking at Saturn.  It's in a perfect place in the sky that I'll be able to watch it for the next several months.

More details on Jupiter a little later -- promise.

Saturday, April 12, 2014

Unusual Light On Mars

The Curiosity rover on Mars imaged some unusual events the other day.  Here's the link to the NASA press release.

It's most likely that these "raw" images have been calibrated in some way. Normal CCD calibration includes removing cosmic ray events. I would expect that a paper has been published on the calibration procedure for Curiosity (MSL). I'm going to try to find it. Because -- if cosmic ray events are removed, then it's hard to imagine that this is a cosmic ray event.

I've spent quite a bit of time over the years looking at Mars images. I don't recall ever seeing a cosmic ray event on any Mars images, although they clearly should happen very very often (my own experience with astronomical imaging tells me this). Perhaps since these cameras are "hardened" for space, they block most cosmic ray events? I find that theory doubtful.  The NASA people say that cosmic ray events appear on images "nearly every week" but as I said I don't ever remember seeing one.

So I have a hard time with the cosmic ray explanation.

I also can't be too sure about the "glint" theory. Only one of the navcams saw this (the right one). The left navcam image, taken at the same time, shows nothing unusual. Check it out yourself at http://mars.jpl.nasa.gov/msl/multimedia/raw/ Left/Right Navigation Camera, Sol 559, timetag 2014-04-03 10:00:03 UTC. The earlier one is Sol 558, timetag 2014-04-02 09:04:28 UTC. Same thing: right navcam shows the event, left doesn't.

I have no theory as to what this is. I make two additional observations:

Obs 1: These events are 24h 55m 35s apart. A "solar day" on Mars is 24h 39m 35s. A close correlation.

Obs 2: Looking at the two images and blinking between them, it seems to me that whatever it is, it's in the same location on the surface in both images.

However, I can't come up with an explanation as to why a glint would appear in one camera and not in the other. Cosmic rays could, however. But as I said above, I would think that cosmic rays would be filtered out during calibration. Then to have two in as many days doesn't seem likely.

I think they should turn around and take a closer look. They have 30+ years of power, so why not? That rover should live up to it's name and here's a perfect chance to do so.

Tuesday, April 8, 2014

More Data, Calibration Woes, Io and Europa, Relative Photometry

More Data

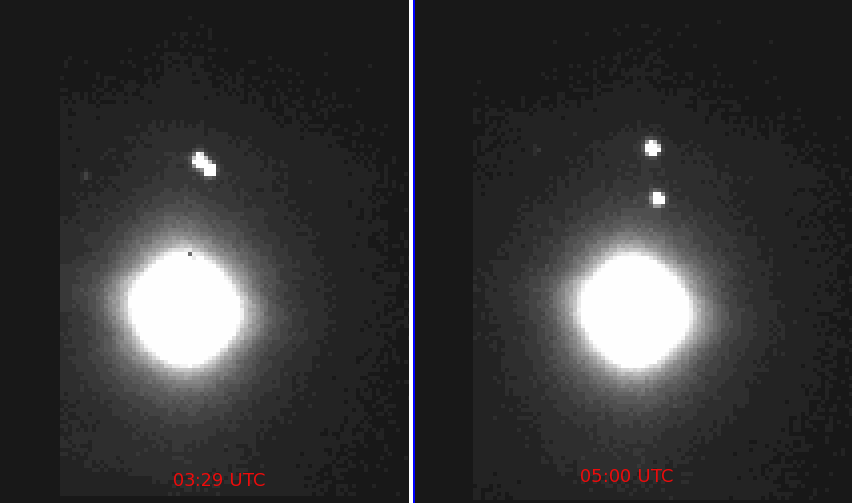
Another good session last night.  It was still pretty cold so I just ran for a couple hours -- from 02:49 to 05:21.  I was aware that an Io egress was supposed to happen, but I couldn't remember when it was and because of my setup, it wasn't easy to check.  So I didn't pay much attention and just enjoyed "sitting back" and watching the show.

Indeed at about 03:43 (I have no way of confirming this since I didn't actually record it, but this site says so) Io appeared.  Here's a before and after image set:

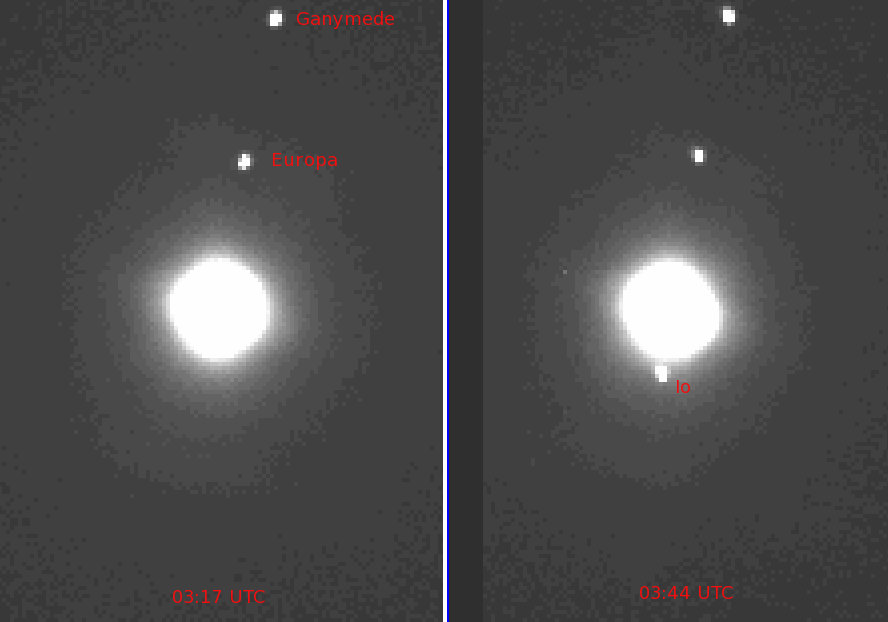
Figure 1: The Jupiter system showing Io egress


I did a hand-eye measurement of the distance between Io and Jupiter and got 42.12 arcseconds.  According to this site, the distance was 39.24 arcseconds.  So I'm within one pixel of the predicted distance.  Not bad.

Calibration Woes

I'm seeing two problems with the data and I think they're both systematic and I hope measureable and calibratable.  The first one I've alluded to in previous posts -- the tendency for the targets to be "bright" when they enter the field of view and slowly "dim" as they move across the FOV.  This is a general tendency but not 100% consistent.

I took some data last night that should show this problem if it's something inherent with the hardware.  A series of fifteen, 1 minute exposures were taken to produce star streaks across the entire array.  The results all look about like this:


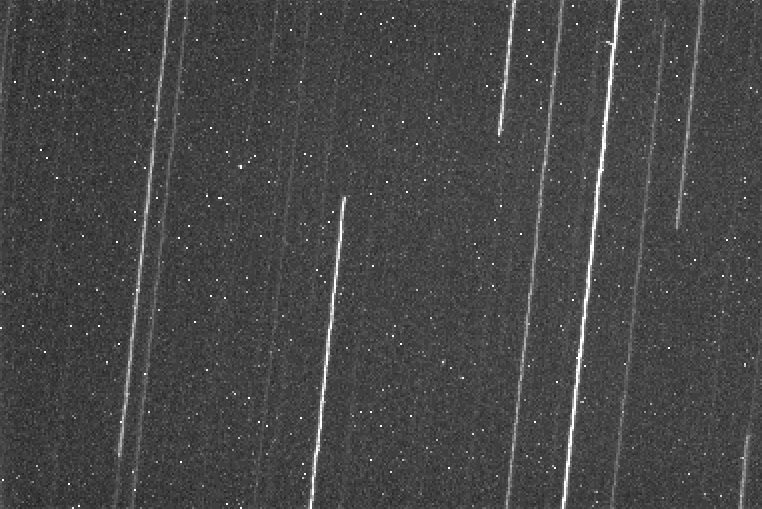
Figure 2: 1 minute exposure star trails
A plot along the bright trail on the right in this image produces this:


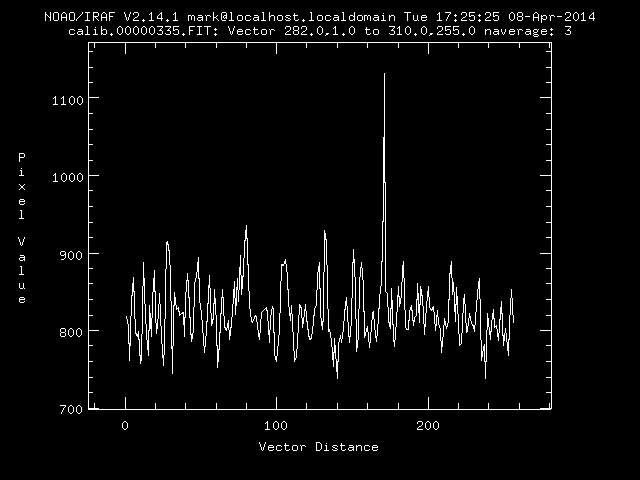
Figure 3: Plot along a bright trail

As you can see, except for some wiggles, there is no general tendency for the target to be brighter when entering the image (the left side of the plot) and progressively fainter as it leaves the image (the right side of the plot).

So what accounts for what I'm seeing in the data?  I don't know (yet!).

The other systematic problem I'm seeing is that the data seems to get noisier as the night progresses.  The following is a plot of the brightness of Callisto as a function of time.  As you can see, the data at the beginning of the night is pretty tight.  At the end of the night, however, the data is quite a bit more scattered (although the mean looks consistent).


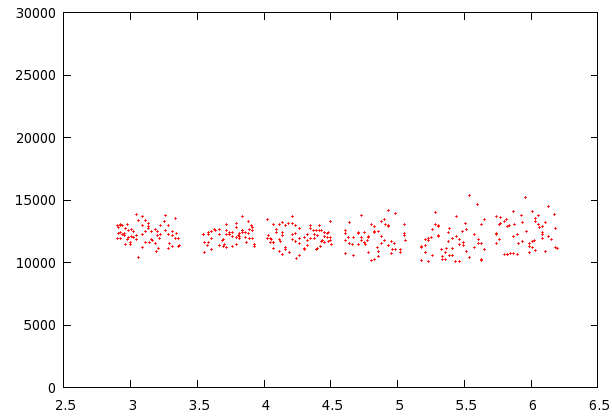
Figure 4: Callisto photometry 02 April 2014 UTC


Why?  This data has been corrected for atmospheric extinction, so why am I seeing this progressively larger scatter?

I've seen this in other data.  My only guess at this moment is that there are other factors with extinction that I'm not taking into account.  I don't think it's higher-order terms since the overall plot looks "flat".  However, something is making this data scatter more, and the only thing that's changing on my end is that I'm looking through progressively more atmosphere.

Io and Europa Mutual Event

During the 02 April 2014 UTC sesssion, Io and Europa passed very close to one another.  Here's a picture of the event:


Figure 5: Io and Europa in a near miss


My software would see the image on the left as a single target and will therefore show a brightness that's the combination of the two moons.  Over time, the two separate enough to allow the software to detect both as separate targets.  The photometry for each will settle into its spot.  This is indeed what I've got, with some surprises.


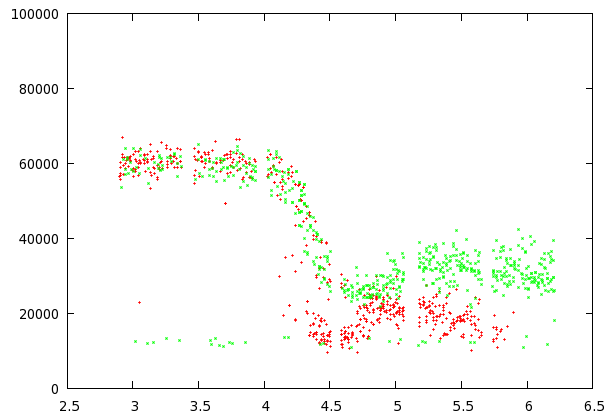
Figure 6: Io and Europa photometry during a mutual event


The green points are Io, and the red points are Europa.  Europa was speeding towards the back of Jupiter at the time, and at about 05:51 UTC it got too far into the bright disk of Jupiter to be detected by my software.

So indeed at the beginning of the session, the two moons has a combined brightness.  At about 04:07 UTC, they started to separate enough that they began to appear like two targets instead of one.  This took place over the course of several minutes (about 04:07 to 04:28 UTC) until as you can see on the right side of the plot, there are two distinct targets with different brightnesses.

However, there are structures within these plots that I can't account for.  Looking at the Io data (the green points), there's a very obvious smooth drop in brightness from about 04:30 to 05:00 UTC.  After that, the photometry looks pretty steady (with the exception of the aforementioned larger scatter).

This same dip in brightness appears in the Europa data but for a shorter period of time (about 04:30 to 04:43 UTC).  Europa is close enough to Jupiter that I'm not sure how seriously to take the points after about 05:00 UTC.

I should probably write a simulation to see perhaps more clearly what the photometry is supposed to be doing.  But my guess is that those dips probably shouldn't be there unless there's something else going on.

My only guess at the moment is that maybe I'm seeing the "atmospheres" of these two moons as suggested by Degenhardt in what he calls "atmospheric extinction".

Relative Photometry

Because of the ongoing systematic problems, I'm inclined to take a hard look at doing relative photometry and see if these problems sort of "go away".  The problem with relative photometry is that I'm not going to be able to easily separate out which moon is contributing what to the resulting light curves.  Once in a while I'll get a bright-enough star in the FOV, but I can't rely on that so the curves will be one target's brightness compared to another's.

Asteroid Data Hunter

This project is a joke.  I don't say this because I lost the first phase, but because the entries are nothing like what's needed to detect asteroids.  So I've decided to not waste my energy on this and instead work on something more direct -- especially since I now have actual data to work with.  Here's part of an email that I've sent to the PI for the CSS:

Part of my reason for writing you is to tell you that this winning Problem Statement is seriously flawed.  It's not flawed because the creator is stupid or a poor writer, or that the reviewer is stupid.  It's flawed because of ignorance about the problem itself.  The winning Problem Statement document very clearly shows this ignorance, and the fact that it won the competition shows this ignorance extends to the reviewer.  For example, things that are irrelevant to asteroid detection and astronomical imaging in general are included, and things that are very relevant are left out.  The blind are leading the blind.
...
I've come to the conclusion that this competition will fail to produce the results you're looking for.  The law of "garbage in, garbage out" applies. You cannot simply *hope* that a reasonable algorithm results from this competition.  With what I've seen so far, it would be *incredible luck* that you get anything that works at all -- much less, better than what you already have.

I've further come to the conclusion that my entry will fall onto the ignorant eyes of the reviewers and testers.  Because of MY ignorance about the details of how TopCoder works -- and despite my best efforts -- my entry will most likely fail.  I'll be producing oranges instead of apples again.  My work will be ignored not because it's a terrible solution, but because it doesn't fit within the flawed parameters set forth.  I'd prefer that to not happen.
...
I want you to be as successful in detecting as many asteroids (NEOs or otherwise) as you possibly.can.  I want the algorithm I've developed to be used for this important and exciting work.  So I give you an unsolicited gift: Everything I have in regards to asteroid detection is yours.  No strings attached.  No acknowledgement or compensation necessary.  I will work with you at any level you wish to make this happen.
...
I'm sure you'll see the value in what I'm giving you and I hope you won't blow me off as some idiot guy who *thinks* he has the best solution to a very difficult problem and is just angry about not winning the competition.  I don't care about winning or losing.  I also don't claim to have the best solution.  I claim to have a solution that produces very accurate and reliable results.  I'm certain you'll be pleased to see that for yourself.

I have two sets of the their data -- two sets of four images.  I also have their detection and rejection files.  So my plan is to proceed and get some code written to do what I described in my ADH phase 1 entry paper.

Wednesday, April 2, 2014

Consecutive Evenings

For the first time in this project, I have data from two consecutive evenings!

Plus, it looks like maybe tonight is also going to be clear and calm.  Three nights in a row?  Maybe so!

Here's a quick couple images from last night showing the relative motion of Io and Europa, as well as motion of the Jupiter system itself against the background stars:

Figure 1: The Jupiter system 02 April 2014

It's gonna be sorta neat to watch the photometry of Io and Europa over this evening.  At the start, the photometry will show one object since they're so close.  So the values will be some combination of the two.  As the night goes on, however, Io and Europa separate enough for the software to distinguish two objects.  So the photometry will show a "single object" at a certain brightness, and then that line will split into two separate brightnesses, presumably slightly fainter than the combined brightness, but at pretty much the same distance and position angle.

1800 images were taken last night.  About 1282 have data in them.  962 images have Jupiter in them.  So as long as I'm hitting about 50% with the "Jupiter in the image" stat, I'm ok with my performance as a substitute telescope drive.

Tuesday, April 1, 2014

Clear night and April Events

A very decent session last night tobegin the new month and the new lunar cycle.  The moon was a thin, 30 hour sliver and was nice to see so young.

I'll post more later as I have a number of new things to talk about.

But for now, here's an image from last night (notice I've reversed the greyscale, so black = bright):

Figure 1: The Jupiter system 04:00:52 UTC 01 April 2014
I've numbered five background stars in this image so you can compare it to the AAVSO sky chart of the same area:

Figure 2: AAVSO chart of same region


The crosshair in Figure 2 correspond to RA 06:49:14.5 and Dec +23:12:29.  I mention this because at least according to the ephemeris on the Heaven's Above website, Jupiter should be at RA 06:50:14.5 Dec +23:12:29.  As you can see from the image, Jupiter is not at the location specified by Heaven's Above.

This site seems to do a better job at calculating the correct position.  Here's the same chart showing the calculated position of Jupiter:


Figure 3: A better position of Jupiter marked

So, Heaven's Above -- you're fired!  This makes me question all the other information on this site now.

I'll make another post later today or tomorrow as I have a number of things to talk about.

==== Mid-day Update ====

Wow this is a really great site.  A lot of very useful info for me can be gotten from this site, including positions of the Jovian satellites and how far away they are from Jupiter.  Plus, very cool charts like this one:


April Jupiter moon eclipses that I'll be able to record:

DD  HMM.M
 6  414.0  II EC R
 8  343.8   I EC R
11  329.4 III EC R
15  538.8   I EC R
18  4 7.5 III EC D

There are also some near conjunctions that have become pretty interesting to record.

MMDDYY    Moons   HH:MM
040914    I/E     05:00
042214    I/E/C   03:00
050214    I/G     03:00
050414    I/E     03:00
050514    E/G     03:00
050614    I/G     05:00