Thursday, March 27, 2014

Systematic Errors Yes and No

Does my data contain systematic errors?  You bet, it does.

Do those systematic errors make the data useless?  Not in the least.

The systematic errors are contributing to the overall error, but when the overall error is 2 - 4 percent, I'm not going to worry about them too much.

I spent all of yesterday looking at these errors and, while they're annoying, they appear to be in the raw data which means nothing I can do on the software end is going to change that.  I'm not going to try to explain to my readers what I'm seeing, because unless you've been looking at all of my data as much as I have, you probably won't see it.  However, this is the kind of plot I was looking at all day:

Figure 1: Photometry data from 23 Mar 2014 UTC

Now I guess that might look a bit scattered.  Staring at it a while will allow you to start seeing some patterns.  See them?  But consider the scale on the y-axis, plus the overall scale of the data (zero to 65535).  When I do this, I realize that the data in Figure 1 has an error of 2.18%.  This is well within my tolerances as far as having confidence that I'll be able to see variations in the lightcurves as these moons orbit Jupiter.

So now I can say, for the first time in this project, that I'm confident about the data that I have.  It seems consistent to a very reasonable tolerance.

I now, therefore, move on to more important matters.

Photometry versus Phase Angle

What I'm slowly moving towards is being able to plot phase angle versus photometric value.  When I do this, I should see variations similar to those shown in those USGS plots I did on a previous post.

To calculate the phase angle, I need to know three pieces of information:

  • The distance from the target to Jupiter
  • The direction of motion of the target (toward or away from Jupiter)
  • The side that the target is on (east or west of Jupiter)

I've created a little parameter file that will contain data used for this calculation (as well as the data needed to calculate the airmass of the observations -- needed to correct for atmospheric extinction).  In this case, the data is the distance (in AU) to Jupiter.  I need this in order to properly calculate the radius of the orbits for each moon in pixels.

The phase angle is then defined:

cos (phase angle) = measured distance / radius

I also need to know what "quadrant" the moon is in, and the direction of motion and the side tells me that:

Quad 1: east moving away
Quad 2: east moving toward
Quad 3: west moving away
Quad 4: west moving toward

So with all of this info, I can calculate the phase angle, which of course will go from zero to 360 degrees.  I've decided to define zero degrees as the point in the orbit when the moon is directly behind Jupiter and moving east.  This is an arbitrary definition and I'm not sure if it's the standard definition.  Once I find out what that is, it's likely I'll have to change mine to fit the accepted geometry.  No biggie.  The parameter file I mentioned above will also contain this information.

"Lost" Data

The other problem I'm trying to figure out is that a lot of data is "lost" because Jupiter is out of the field and therefore I can't compute a distance.  I've got an idea about how to deal with this and I'm hoping to try that out sometime very soon.  Callisto will especially suffer from this since it almost always is going to appear pretty far from Jupiter.  But as I said, I've got a possible solution and I'll see if that helps in any way to at least give me a way of looking at all of the data even though it may not be as exact as I would like it.

Data Reduction

I still have a backlog of new data to reduce.  I also need to go back and re-reduce all of my old data so I can start looking at this phase angle stuff.  Once I get the phase angle code running, I look forward to plotting all of this data to start looking for photometric variations.

Tuesday, March 25, 2014

Asteroid Data Hunter, Backlog Jupiter Data, Relative Photometry, Things To Do

Asteroid Data Hunter

I'm still sorta recovering from my marathon session creating my entry for the Asteroid Data Hunter competition.  I should know the results of the reviews later today.  I'm having very strong doubts that my proposal is "good enough", but that decision is out of my hands.  I look forward to seeing all the other entries.

This is a pretty big deal if I win, but for now I'm keeping my excitement to a minimum.

Backlog Jupiter Data

Wow -- I have a backlog of data that I still need to reduce and get prelim analysis.  Never thought I'd be saying such a thing for my own data.  It's just plain old work to reduce data.  Just gotta do it, that's all.

I've modified my data collection technique in that now I'm taking 300 images per "set" rather than 200.  While 846/1800 (48%) images actually have Jupiter in them, because of the geometry of the moons (Callisto being pretty far away), I'd say that something like 85% of the images have SOMETHING in them of value.  So that's something around 1500 new data points.

I'm pretty excited about these last couple of data sets since they contain my first known observations of eclipses.  The one involving Callisto ingress into eclipse on 20 Mar 2014 caught me totally by surprise.  The session from 23 Mar 2014 has an Io egress out of eclipse.   I look forward to plotting each of those light curves to see when and how these events occurred.  I need to go back though all of my data now to see if I've already recorded one of these events without knowing it.

Here are pics of the Io egress event:

Figure 1: Io egress event

The times for these images are:

Upper left: 05:22:04 UTC
Upper right: 05:22:27 UTC
Lower left: 05:24:02 UTC

I'd say my timing error is probably +/- 2 seconds but I'll have to compare the internal clock with the WWV to be certain.

Using the predictions from this site, I note that the time of this event is 05:24:54.  So I see that my timing is off by about three minutes (three minutes early).  Not sure why.  I need to check my internal clock on the computer but I doubt it's drifted that much in just a month.  I also don't know what this 05:24:54 time is -- if it's for the start of the egress, the end of the egress, or the middle.  All I can say at this point is that it appeared fairly suddenly over the course of about one or two minutes.  If my timings are correct, then I'd say that the time from IMCEE is the time of the END of the event (when Io reaches its nominal magnitude and is totally out of the shadow of Jupiter).

I guess there's nothing else I should really do until I get the atmospheric extinction stuff built into the code.  This requires me writing some software that'll do least-squares fitting to a polynomial of an arbitrary order.  I want to write a general fitting piece of software like this so I don't have to come back later an expand on just a simple linear fit.  This requires dusting off some old books and reminding myself how to compute things like determinants and cofactors.  Ah, mathematics.  So really, until I have some working code to do this kind of thin, there's no point in running through the data.  The data will be there and continue to collect it.  Tonight looks like it's gonna be a good night with Io at max elongation and Callisto and Ganymede in nice positions.  Europa is gonna be heading closer to Jupiter, so I'm likely not going to get anything useful outta her.

Relative Photometry

I was staring at a background star the other night in the same FOV as the Jupiter system and remarked to myself that I could be doing relative photometry of each moon with that star.  I can assume for the time being (until I find out what star this is) that the star maintained a constant brightness over the period of the session.  This means I can compute the ratio (of the difference) between the background star and the moons to see how they vary in brightness over time.  This kind of measurement mostly eliminates the need for extinction correction.  But it also pretty much eliminates all the noise from the system, leaving just the raw photometry.

Things To Do

Gadzooks!  So what first?  Do the extinction software work, or focus on relative photometry?  I guess I'm leaning more towards the latter because it probably involves a bit less work.  Linear algebra was never my strong point, although as I recall it was easy to encode.  I'll work on both today, for sure.  Just not sure which one first.  Probably the relative photometry part.

I've also started looking at geometry.  What I need to start doing asap is creating phase plots.  In order to do this, I need to know where in its orbit each of these moons are.  The three pieces of information I have about that is location, distance, and direction of motion.  Phase plots are likely the best way I can visualize any kind of variations in brightness.  The jury is still out on whether or not I'm seeing variations in brightness, but that'll come when I look at more data and put several sessions together (which I'm about able to do!).

Much to do and I'll have an update (hopefully) sometime later today.  For now I'm just trying to distract my brain from just focusing on the Asteroid Data Hunter results.

Thursday, March 20, 2014

Callisto Eclipse, Asteroid Data Hunter

A surprise event happened during last night's session: Callisto was eclipsed by the shadow of Jupiter -- and I watched it happen.  Very cool.


Going....

Jupiter system 04:18 20 Mar 2014 UTC

Going ....

Jupiter system 04:27 20 Mar 2014 UTC

Gone!

Jupiter system 04:32 20 Mar 2014

More info in this to come in later posts.

At the moment, I'm busy working on my entry for the first phase of the Asteroid Data Hunter challenge.

Monday, March 17, 2014

Data From Yesterday Looks Good

Glancing at some images from last night's session has me anxious to reduce the data and look at the results.  I've reserve any expectations because sofar I've been surprised every time.  The seeing was great and I got probably the best focus sofar. 

I collected 1600 images in total.  841 of those images had Jupiter in them.  Looking at individual image statistics, I calculate that about 1141 images had at least one target.  So that's an efficiency of 71.25%.  Not bad at all.  I look forward to the day when I don't have to measure "observing efficiency".

Here's a sample of the data:

Figure 1: The Jupiter system as seem from Earth at 17 Mar 2014 03:30:24 UTC

Wednesday, March 12, 2014

First Look 11 Mar 2014 Data

There were eight sets of 200 images taken on 11 Mar 2014 UTC and I've run them through reductions and gotten some data back to start looking at.

The distance measurements (astrometry) looks really nice:

Figure 1: UT time (x-axis) versus Distance (y-axis)
The red marks are Io, the green are Europa, and the blue are Ganymede.  As you can see, Ganymede was moving slightly away, Europa was moving slightly away, and Io was moving closer over the course of the session.  It turns out that both Europa and Ganymede were at their furthest elongation and were both pretty stable the entire observing session.

Now I look at the photometry two different ways.  The first is distance versus photometric value:


Figure 2: Distance (x-axis) versus Photometry (y-axis)
And then also look at photometry versus time:

Figure 3: UT time (x-axis) versus Photometry (y-axis)

So why are all the targets getting fainter over time?  My guess is that it's atmospheric extinction, which I haven't taken into account yet.  That will be one of my next tasks.  In order to calculate and compensate for extinction, I need to know the hour angle of the target, which means I need to know the local sidereal time.  At the moment, that information isn't stored in the data header.  I'm hoping that I can in the future.  So for now, I'll have to pretty much manually do it all.  Ugh.  In any case, I'll get that going in the next couple of days and hopefully that'll correct that problem.

But there is another effect I'm seeing.  As time goes by, the photometry is "spreading out" -- it's getting worse.  It's happening to all of the targets so it isn't a spacial effect.  I'm not quite sure what is causing this, yet.  I'll need to look at the data and do some comparisons between images near the beginning of the session and at the end of the session to see if I can see any differences.  My first guess is that the PSF is changing (partially due to airmass, but also maybe something else?  Focus maybe?) and that's having an effect on the photometry.  Just gotta look and look and look and try things until I figure it out.

Also, the flux ratios aren't what's expected given the published magnitudes.  I need to get some hard numbers on that and then figure out why I'm seeing differences with these.  Io should be 1.28 times the flux of Europa, and I'm getting something around 1.53.  The flux ratio between Io and Ganymede should be 0.68 and I'm getting 0.87.  My initial guess as to why there's a difference is that my aperture photometer isn't large enough to be letting in all the light.

I'm also seeing some systematics in the finer details as well, but I haven't figured out a way to show it on this blog.  For now all I can say is that as the targets track through the field of view, the photometry is brighter at the beginning and dims until the target is out of the FOV.  I'm thinking that this might be due to the brightness of Jupiter bleeding into the target photometry, but I need to look at individual images to see if that's the case.  I might be able to eliminate that with a simple sky subtraction before I make the photometric measurement.

So much to do and I'm letting the data guide me.


USGS Maps and Flux

So before I get too far into this project, I wanted to do a sanity check on basic fluxes coming from these moons to see if I've got any chance in seeing variations.

I took a map of Ganymede from the USGS website.

I then created an image that contained 2/3 of the latitudes and all of the longitudes.

I created a rectangle that contained 2/3 of the latitudes and half the longitudes.  This represents the half of the moon that I can see at any particular phase in its orbit around Jupiter.

I then summed up the pixel values in this rectangle and went all the way around the moon summing and slowly moving the rectangle one degree at a time.

The results are as follows:

Here is the original full image of Ganymede showing 2/3 of latitudes and all the longitudes:

Figure 1: Ganymede map from USGS
A plot of the fluxes versus longitude shows this:


Figure 2: Flux (y-axis) versus Longitude (x-axis)
As you can see from the plot there is a variation of overall flux.  This is pretty obvious from the picture, too.  It's darker in the center of the image than on the edges.

But .... how much?

Well, it turns out that the maximum flux difference is 8.7%!  This is well within my (sofar) measuring accuracy of about 4%.

So what this means is that -- at least according to this "official" USGS map of Ganymede -- I should be able to see variations in the flux as this moon orbits Jupiter.

Very cool.  I need to see if I can get similar maps for the other three moons.  Look at the same USGS site, the data doesn't appear to be consistent.

Did the same thing for Io, and got a 5% variation.  Hmmm, that's right down there with my accuracy.


Figure 3: Io.  2/3 latitudes, all longitudes

Figure 4: Same plot as Figure 2 except this is Io
And also for Europa, which shows a huge 16.9% variation in the flux:

Figure 5: USGS map of Europa showing 2/3 latitudes and all longitudes


Figure 6: Flux values

And finally, Callisto:


Figure 7: Same as the others, except this is USGS Callisto

Figure 8: Same as the other plots, but this is Callisto

The Callisto plot is showing a stunning 19.7% variation in the flux.

This is all very good news for my little photometry project.  This tells me that I have a really good chance to at least see variations in brightness.

===== UPDATE =====

Looks like I might have to cancel tonight's session due to dust.  It's been pretty dusty all day and now at 00:30 UTC it doesn't look like it's letting up.  Dust is at least as bad as clouds when it comes to getting consistent photometry.  Look at that huge halo around the sun!

Figure 9: Lots of dust in the air today means I'm likely to cancel tonight's session

So instead I continue to reduce the data I collected on 11 Mar 2014 UTC.  It's looking really nice (4% photometry) but I'm seeing some systematics that I'm gonna have to look at more closely.  Could be related to sky background.

Tuesday, March 11, 2014

Clear Last Night

High thin clouds have dominated the sky over the past several weeks, with only a few instances of moderate clarity.

Last night was the first night since I started this project where I both knew what I was doing AND it was clear.  A few high clouds drifted past very quickly during the early part of the session, but other than that it was a very productive evening with a lot of new Jupiter data.

I also got what appears to be some great star data for my consistency testing.  Last week I decided on 20 Orionis as my test target, but when I got started last night I decided that I really needed a star I could actually see in my very primitive 1x "guidescope".  I noticed a faint little star just below Aldeberan, so I pointed the scope at it.  To my surprise, it was a very nice "binary" star.  It turned out to be Theta 1 and Theta 2 Tauri, visual magnitudes 3.84 and 3.4 respectively.  Even with a 0.1 second exposure, the max values were very near saturation, but they seemed to stay within those bounds and the better signal-to-noise I have, the more stable (hopefully)  the photometry is gonna be.

Hopefully either later today or tomorrow I'll calibrate the data and run it through my photometry code to get some numbers.  For now, just a picture:

Figure 1: Theta 1 Tau & Theta 2 Tau, 11 Mar 2014 03:38:34 UTC
This set of data also allows me to better calibrate my pixel scale.  These two stars are 5.62 arc minutes apart, or 337.2 arc seconds apart.  I measured the pixel distance between these two as 129.096 pixels.  That gives me a pixel scale of 2.612 arcsec / pixel.

Ah Jupiter

Last night for the first time I was able to get data for Io.  It was at maximum elongation from Jupiter and just appeared to hang in the same place the entire four hour session I collected data.  Callisto was too close to Jupiter to likely get any decent data.  Europa and Ganymede were on the other side of Jupiter very well spaced apart and far from the planet.  I should get some excellent data from them.

Again, for now, just a picture:

Figure 2: The Jupiter system as seen from Earth 11 Mar 2014 05:15:42 UTC
In total, I have 1600 Jupiter images from last night.  I'm hoping that I got at least a 50% observing efficiency.  So that means about 800 images of good data.  That's a huge amount and I'm very excited to run it through my photometry code to see how the numbers look.  I'm optimistic.

The forecast is still saying partly cloudy tonight, but then a run of clear nights starting Wednesday (13 Mar 2014 UTC) and running at least through Sunday (17 Mar 2014 UTC).  Whew -- so that means I could potentially be seeing a LOT of data and quite a few number of late nights.  Jupiter is pretty much too low to make any reasonable observations after about 08:00 UTC at my location, so that's not too bad.

Circular Aperture Photometry

I now have the software written to do circular aperture photometry and my preliminary look at the 27 Mar 2014 data improves the photometry -- at least by my eyes.  I need to run the numbers to see how consistent they are.  I also need to run this code with the data from 12 and 19 Feb 2014 to see if those values will improve.  Very exciting.

Wednesday, March 5, 2014

Results, Clouds, Database

The last observing session I did on 27 Feb 14 has yielded some very promising results and hopefully will lead me in a direction of obtaining more precise photometry.

Mainly high, thin clouds continue to torment me.  My estimate of 50% clear skies appears to not be a correct estimation!  However, our official dry season starts in another month or so.  I'm still hoping to get to that 50% mark.

M35 Observations

I spent quite a bit of time that evening collecting data from M35 in order to see if I could get more consistent photometry from target stars away from any kind of bright source that may be contaminating the photometry -- especially if clouds were in the area.

Unfortunately, the photometry from this exercise is all over the place and not very useful in terms of helping me understand if what I'm doing is ok or not.  I attribute this to the fact that the sources were actually very faint.

The brightest star in the field was somewhere between 8th and 9th magitude:
Figure 1: M35 Image showing brightest star
I use this bright star to measure distances and angles to all the other detected stars so I can separate out the photometry for each individual.

The following plot shows the photometry (y-axis) versus the distance (x-axis) from the brightest star:

Figure 2: Photometry versus Distance
As you can see from the plot, the photometry of the brightest star (the vertical line of dots on the far left) shows a variation from about 2500 to 3500 counts.  Something that does interest/concern me is the fact that the photometry appears to be better (i.e. more consistent) for fainter targets.  You can see the next vertical line of points at a distance approximately 10 pixels from the brightest star is four times fainter but only has a photometry spread of about 400 counts.

So I'm not going to jump to any conclusions about this until I'm able to look at some brighter stars.  This exercise with M35 was difficult, mainly due to the fact that the equipment I'm working with makes it "nearly impossible" to keep the target in the field of view.  I'm having to manually point the telescope at a place in the sky about half the diameter of the moon at a target I'm trying to acquire that isn't visible to me (I'm pointing to a blank space in the sky).  This is just hard, hard, hard.

But, for now this is what I have to work with and despite all of that I'm having a great time and I'm continuing to see promising results -- as you will see below.

So the lesson learned here is that while M35 is a rich cluster of stars and I have more than enough stars to choose from, it's just way too faint to conclude how consistent my photometry is.

My plan now is to find a brighter source and do the same kind of exercise.  I think I've found a very nice candidate over in the constellation of Orion.  The star designated '20 Orionis' is a single star but very nearby is another star.  Here's the AAVSO chart for that region showing a 20 arcminute field of view:

Figure 3: 20 Orionis and companion
The brighter star on the right is 20 Orionis.  The coordinates of the crosshair is shown up at the top of the chart.  This star is about 5th magnitude and I'd guess the companion is about 6th or 7th.

I chose this star over something brighter because it's about the same magnitude as the Galilean satellites and I wanted to try to compare apples to apples.  I could certainly pick something brighter that would be (probably) easier to acquire and keep in the field of view, but then I wouldn't necessarily be doing an equivalent comparison.  So as hard as this is going to be, I'm determined to do it.  If I'm able to acquire this star and collect an hour's worth of data, I should have what I need to build some confidence in terms of seeing consistent photometry.

Jupiter Observations

Unfortunately, because I spent a considerable amount of time at M35, I didn't get a lot of Jupiter observations in.  I did one session at the beginning of the night and another towards the end.

I'm defining one session as a series of 200 images.  My duty cycle is six seconds, so one session works out to be about 20 minutes long.  In that time, I've usually been getting eight good sets of data.  A reminder and explaination: because my telescope doesn't track, the targets "move" from one side of the field of view to the other in about one minute -- I then have to move the telescope west in right ascension to re-acquire the targets.  My motions are pretty crude so I usually overshoot and have to wait for the targets to "move" back in to the field of view.  Once I obtain 200 images, I take 20 dark images for calibration purposes.

So in any case, during one 20 minute session I usually get about 64-72 total data points.  Yes, this really really sucks.  Out of 200 images, 64 to 72 images are useful.  That's 32% to 36%.  I'm hoping with more time to practice this technique, I can get to at least 50%.  If and when I'm able to get a telescope that tracks, I'll be close to 100%.

Once again, Io was hidden in transit and therefore wasn't visible.  Callisto was pretty much as far away from Jupiter as it gets (and therefore was rarely in the same field of view with Jupiter and the other two moons, which is problematic for measuring its distance to Jupiter).  Over the course of the evening, Europa and Ganymede got closer and closer to one another (Ganymede going out, Europa coming in) such that when I looked at them in a later session, their photometry combined and therefore made those measurements useless (for now!).

Here's an image from the first session:

Figure 4: The Jupiter system at 05:04:04 UT on 27 Feb 2014
Here's an image from the later session:

Figure 5: The Jupiter system at 07:01:57 UT on 27 Feb 2014
Notice how much closer Europa and Ganymede are in the later image.  Their light starts to "bleed" into one another and makes the measurement all but useless.  My next task is to improve the way I'm making the photometric measurements and hopefully this won't be as big of a problem.  But these things happen all the time with all the moons, so it'll be something to deal with.

Now that I have a database set up (see below), I can more easily separate out the photometric measurements based on distance and angle from Jupiter.  When I do this, I get plots like this:

Figure 6: Session one photometry
The x-axis is the time in UTC and the y-axis is the photometric values.  The red points are Callisto, the blue points are Europa, and the greed points are Ganymede.

Running statistics on this data, I get about a 5% spread in the photometry.  I'm fairly pleased with that.  This is reasonably consistent.

But there is a "systematic" thing that I'm not too sure about yet.  Why does the photometry brighten after 5.15 UT?  Not sure.  I need to look at the images to see if there was anything different between the set right before that and that particular set.  The values settle back down towards the end, so I'm thinking that maybe it was a passing cloud (which were still in the area for sure).

There are fewer red points (Callisto) because this moon moved out of the field of view and I wasn't able to measure it's distance to Jupiter.  The photometry is there, but I haven't figure out a decent way of extracting it based on some other parameter other than distance and angle.  Here's a plot showing ALL of the photometry data from that first session.  As you can see, there are many more red points:
Figure 7: Session one all photometry
I'm very happy to see the photometry pretty flat across this 20 minute session.  Five percent photometry is nearly "good enough", although I still have no idea what to expect in terms of actual variations in brightnesses as these moons orbit Jupiter.  Time will tell, I hope.  If there's a 10% change, I'll see it.  If there's a 2% change, I won't.

Database

I now have the MySQL database integrated into the software.  So all data is now being stored in this database.  This will allow me to look at the data in several different ways, depending on the query.  Here's the layout of the tables:

Figure 8: Database table structure
Not much to say about this except I'm glad I've got this integrated into the software.  Another task complete!

Moving Forward

Moving forward, one more important thing needs to be done in the software.  That is: circular aperture photometry.  I need to get away from square box photometry and make these photometric measurements based on the shapes of the targets: circles!  So this requires sub-pixel stuff and that gets messy.  I've done it before so it's just a matter of remembering and doing it.  That should be done over the next couple of days.

I'll then run all the data through again and see if there are any differences.  I'm hoping for slightly better statistics, but I don't expect the overall photometry to change all that much.

The obvious thing moving forward is just collecting more data and settling into a routine.  I want to do this bright star test with 20 Orionis just to see how consistent the photometry can get without any nearby bright object contamination.  So other than that, the plan forward is to collect as much data as I can over the next several months.

Tonight looks like it's going to be clear, but I'll have to see how the high clouds perform.  The moon is also going to be a problem over the next week or so as it moves closer and closer to Jupiter on towards Full on the 16th of this Month.  I'm anxious to see how the moon effects the photometry.

Monday, March 3, 2014

Ambient Online Sample Challenge #13 Entry

I have a lot of fun with these sample challenges, but usually IMO all the other entries are far better than mine.  But it's fun to try to be a little creative and come up with something interesting that others might enjoy as much as I do.

Ambient Online is a great place for all sorts of ambient & space music.  Check it out and give it a listen!

Here's my sample challenge entry:

http://soundcloud.com/cosmiclettuce/guitar-strum

Hope you enjoy it.

Saturday, March 1, 2014

Feeling The Data Crunch

Already I'm beginning to feel the data crunch and this project has hardly even started!  So I continue to think about and plan how I'm going to handle what will be a huge amount of data coming in.  This leads me to the concept of "Pipeline Processing" which these days isn't so much of an unknown term.

Pipeline Processing

The basic idea is that on one end of the pipeline you have raw and calibration data coming in , and then other end of the pipeline you have "data products" coming out.  In between you have a number of steps to produce these data products, with various probes stuck in at various places to obtain what I call "telemetry data" -- which are actually just additional data products.

One thing for sure that I need to integrate into this project as soon as I can is a database.  Not only is this an excellent way to store telemetry data, it can also store the final data products.  The best thing about databases, though, is their ability to be searched.  A well written database query is like a beautiful song.

One other cool thing about pipeline processing is that it's modular.  So I can design a pipeline now and later on I can add to it or take things away.

Pipelines are also semi-automatic.  Well-designed pipelines will alert me to any kinds of problems with the incoming data so I can more carefully (manually) look at them.  But overall it's automatic and therefore can push through a lot of raw data very quickly.  This allows me to devote most of my time and energy to the analysis of the data products rather than the processing and reduction.

Anyhow, so that's on the near horizon.

PSF Fitting

I didn't let the cloud problem with the 19 Feb 2014 data set go.  I wanted to see if there was anything I could do to "improve" the results.  In this case, and improvement would show more consistent photometry.

My preliminary work with this looking at one set of data taken that evening shows that there is a slight improvement in consistency.  Enough so that I should probably take even a harder look at things and see if I can improve upon what I've already done.

Here's what I did:  I started with a calibrated image.  I then manually created four gaussian images to do sort of a "best fit" to four different regions (the PSF "wings") of this raw calibrated image.  Next I combined these four gaussians into a single master gaussian image.  Last, I subtracted the gaussian image from the raw image.  Here's what I got:

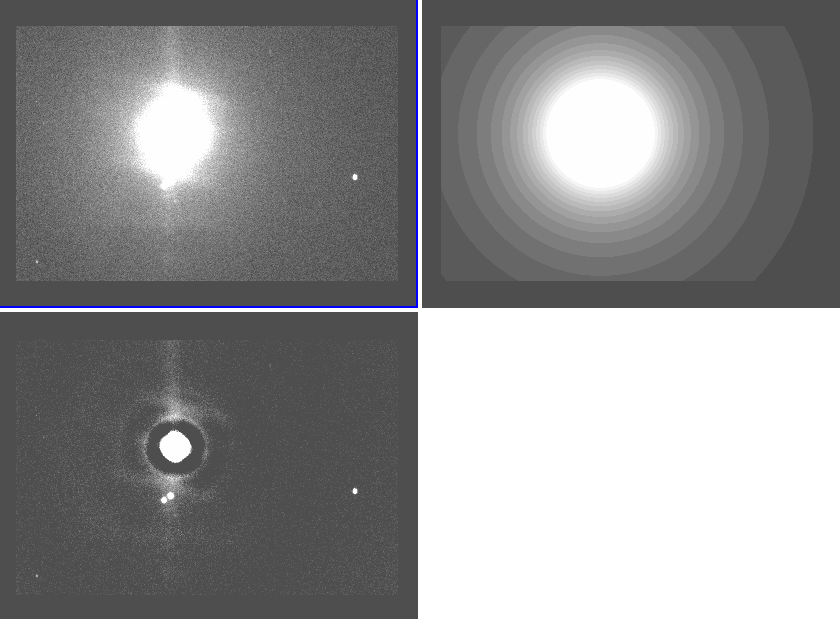
Figure 1: Gaussian subtraction

The upper left is the raw image.  Upper right is the gaussian.  Lower left is the difference between the two.

As you can see, except for the central peak (which I don't care about much -- see below) and some remnants (which are still fairly significant and not modeled well in my manual attempt), the big blob of Jupiter is all but cancelled out.  In the upper left image, if you didn't know they were there Ganymede and Europa aren't visible.  In the lower left, however, they are very clearly there.

The peak values of the three satellite targets in the raw image match the subtracted image to within 1%, so I'm confident that the subtraction went ok.

However, a better model wouldn't create so many subtraction artifacts (like those rings around Jupiter).  So what to do?

Well, there's another "trick" I learned a very long time ago called "Shift and Add" (SAA).  This is where you find the peak value of an image or subarray, and shift the entire image such that the peak value lands in the middle of the resulting image.  Doing this for multiple images and adding them together results in a PSF that is the average of all the images.

Shift and Add is done in speckle interferometry, which is where I learned it.

Applying this technique to a number of raw images, I get this:


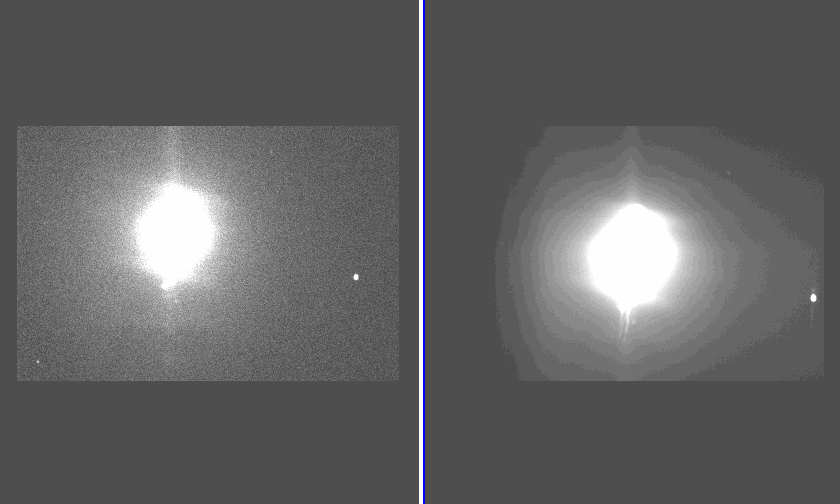
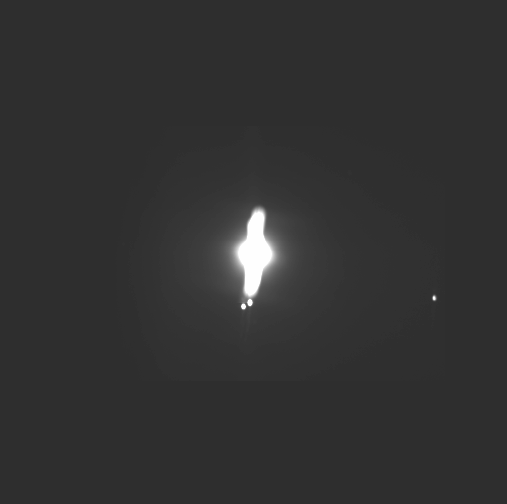
Figure 2: Shift and Add technique

The image on the left is a single image example.  The image on the right is a number of images combined using the SAA technique.

SAA actually does a very good job re-creating the actual PSF, but it has a number of drawbacks.  First and foremost, if there are any other objects in the field of view, it will preserve them (as you can see in the right-hand image, the background star is still there).

Also, depending on the input data, a number of artifacts can be introduced.  Below is the same SAA image, but rescaled to show details closer in to Jupiter:

Figure 3: SAA image, rescaled to show inner structures
If I were doing speckle imaging of Ganymede and Europa for astrometric purposes, I'd actually be pretty thrilled with this result.  However, if I were to use this image as my PSF model for photometry, I'd be screwed.

I'm actually not quite sure what to make of this image -- especially that strange curvy artifact in the center.  I'll have to look closer at the data that went into creating this SAA image to understand what's going on there.  Alas, more work!

So the conclusion that I've sofar come to is that I need to create a rock-solid gaussian model to subtract from the raw calibrated images in order to get uncontaminated (or at least minimally contaminated) photometry of the Galilean satellites as they get close to Jupiter.

This will not help when there are clouds.  The above example is what I'd call an extreme case just to make it easier for me to learn a technique for modeling the data.

Alas, when I look at the photometry using the gaussian-subtracted raw data, I don't see much of a difference.  I'm still looking at this but maybe it isn't worth the effort based on the fact that I was looking through a layer of clouds.  It isn't a realistic test of the gaussian function subtraction technique.  I'll have to use better data (which I think I have from the other night) to create a gaussian model and then see how the photometry looks.

Close To Jupiter

The four Galilean satellites orbit Jupiter in almost exactly the same plane as our line of sight.  So as they move, they get close to Jupiter and either transit Jupiter or are eclipsed by Jupiter, and then they move further away.  Round and round they go.

I did a calculation to determine the best I can expect from a worse-case scenario.  The light from Jupiter is going to effect the photometry of the moons.  That's a fact.  Even with the best system in the world, this will be the case.  The effect from Jupiter gets worse the closer you get to it.  Since all of the satellites will get very close to Jupiter, I need to come up with a way to deal with this problem.  But how much of a problem is it?

The question is, with the optical system that I have how far away does each moon get from Jupiter?  The worse case is when the Jupiter system is furthest away from Earth.  That happens at superior conjunction (SC) when Jupiter is at the aphelion in its orbit around the sun.  Of course at SC the sun is in the way which IS the worst-case scenario!  But as an estimate I can say that this is pretty much the same as being one month before or after SC.

At that time, Jupiter is about 966,118,682 km away from earth.

The orbital radii of the moons are:

  • Io: 421,700 km
  • Europa: 671,034 km
  • Ganymede: 1,070,412 km
  • Callisto: 1,882,709 km
So that translates to a maximum separation of:
  • Io: 90 arcsec
  • Europa: 143 arcsec
  • Ganymede: 229 arcsec
  • Callisto: 402 arcsec
For my optical system (2.683 arcsec / pixel), these values translate to:
  • Io: 34 pixels
  • Europa: 53 pixels
  • Ganymede: 85 pixels
  • Callisto: 150 pixels
So what this means is that at SC, Io (for example) will be 33 pixels away from Jupiter at it's furthest.

That's really really close and it's obvious from the data I've taken that it's gonna be really hard to get good photometry that close in.  I'm going to have to rely on the stable atmosphere (clear skies!) to help me with that.

In my images, Jupiter is saturating the CCD.  Under the best conditions I've seen sofar, the radius of that saturation is about 10 pixels.  So I'm going to guess that no photometry within 20 pixels is going to be of any value.

Io, at worst, is going to be 33 pixels away at maximum elongation.  So at least I'll have a chance.

I guess I should also mention that at best (Jupiter opposition) when Jupiter is closest to Earth, those maximum distances are a bit more tolerable:
  • Io: 130 arcsec (48 pixels)
  • Europa: 207 arcsec (77 pixels)
  • Ganymede: 331 arcsec (123 pixels)
  • Callisto: 582 arcsec (217 pixels)
So good modeling and subtraction of at least the wings of the Jupiter PSF is going to be required to get any decent photometry out of these targets (more so for Io, less so for Callisto).

Well, I think that's all for now.  I'm tired of writing and I'm anxious to start looking at the data I took the other night.

Two other major tasks to complete:
  1. Database
  2. Sub-pixel circular photometry
  3. Mode calculation for sky subtraction
======= UPDATE ======

Very preliminary results from 27 Feb 2014 data looks really nice and consistent.  I'll have more info once I get the database stuff running and I can do proper statistics on the photometry.