Thursday, February 27, 2014

Very Short Update

I've been so busy these past couple of days with the data taken on 20 Feb 2014 UTC that I haven't been able to update this blog.  Rest assured, I'll get you fully informed.  That's my goal for Saturday morning (1 March).

Last night I took more data.  Had to wait until about 07:30 UTC for the clouds to completely clear off, and then went at it for about three hours.  This kind of data collection I'm doing is hard hard hard.  I'll tell you why on the next blog post.

For now, here's an image of the heart of M35.  I'm looking at M35 in order to better understand the photometry I'm seeing from the Jupiter data from 19 Feb.

Figure 1 is my data, Figure 2 is a chart of the same region from the very way cool AAVSO chart maker (http://www.aavso.org/vsp).
Figure 1: Center of M35 image from 27 Feb 2014 UTC


Figure 2: AAVSO chart of same region
The orientation of the two aren't exactly the same, but I'm assuming that my readership is smart enough to make the translation.

The AAVSO chart shows stars down to magnitude 14.  My guess is that my image is getting down to 12-13.  Not bad for a 0.2 second exposure, eh?  Focus looks really good and there doesn't appear to be much in the way of clouds.

More Saturday.

One more thing.  I took a couple of pictures of my "observatory" last night.  In the years to come, I don't know if I'll laugh or cry when I see these.  Maybe both.  In any case, this might be a good argument for "anything can be done given the right amount of determination."
Wayaway Observatory


Taking flats and enjoying the sunset

Tuesday, February 25, 2014

X Flare

I'm glad that I now have access to calibrated data from SDO so I can examine features on the sun in ways that I want rather than relying on uncalibrated jpeg crap.

I'm not too keen on the "exciting" events like today's X4.9 blast, but it sure is a pretty sight.  Here's an image taken by SDO with the 1600A filter at 00:45 UTC on 25 Feb 2014:

An X4.9 boomer at 00:45 UTC
I've played with the scaling to bring out that cool-looking loop structure and added false color to show off features that may otherwise not be noticeable.

The width of that outer loop is about 37,400km (three Earth diameters).  Do you feel small yet?

I also like the fact that this event was so bright that it caused internal reflections in the optics.

An hour later, this region is still "glowing":

Same region at 01:45 UTC
Same scale, same false-color.

Sunday, February 23, 2014

Scatter

Looking at all of my 20 Feb 2014 UTC data, the photometry is all over the place.

Why?

There's one hint: the photometry is "better" for targets furthest away from Jupiter.

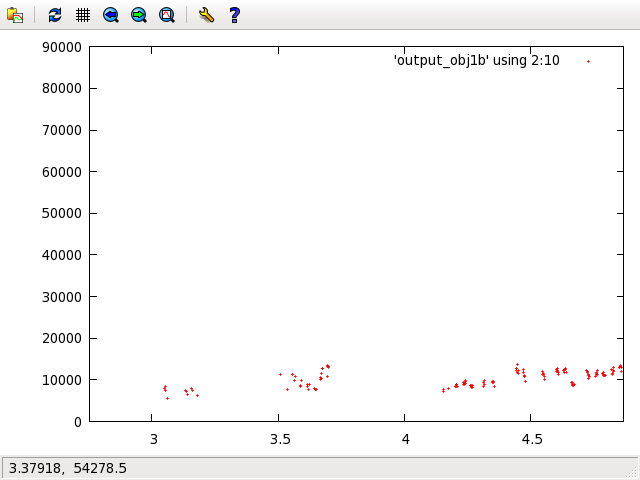
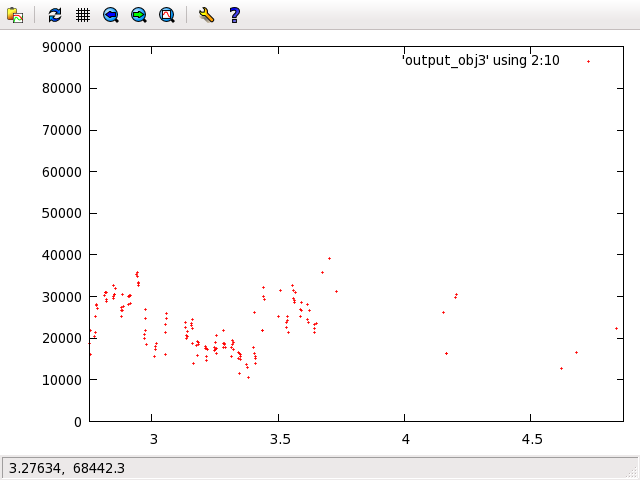
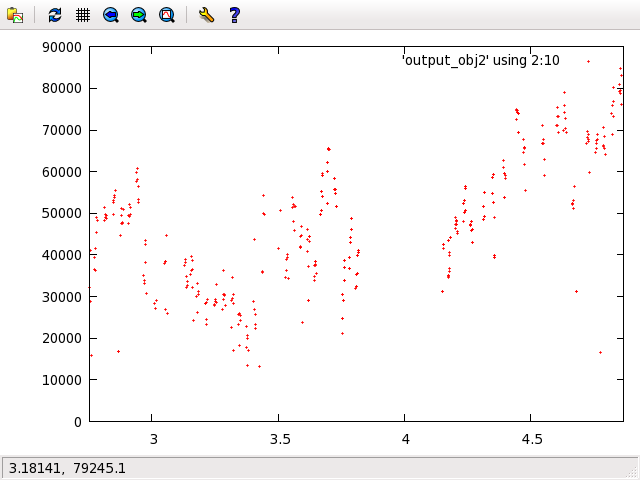
In this data set, there were four targets: Europa, Ganymede (both near Jupiter -- approx 60 pixels away), Callisto, and a background star (both far away from Jupiter -- approx 185 pixels away)  As you can see below, the two nearby targets have very very very poor photometric continuity, while the two far away targets are more consistent (but still quite terrible):
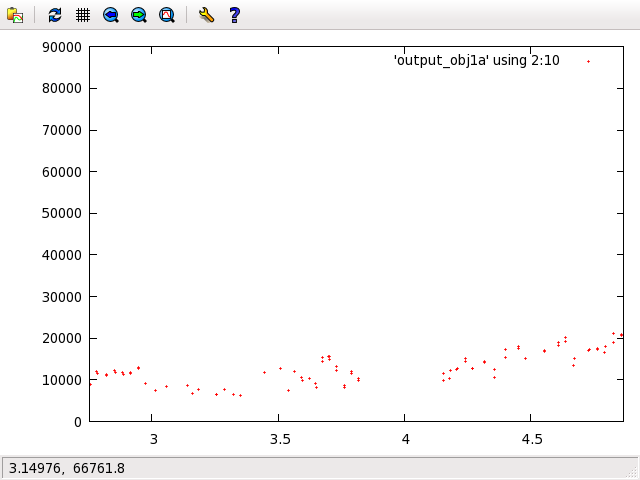
Figure 1: Callisto Photometry

Figure 2: Star Photometry

Figure 3: Europa Photometry

Figure 4: Ganymede Photometry
Since Europa and Ganymede were so close to each other, their photometry began to mix which is why there's an absense of Europa photometry after about 03:42 UTC and a corresponding "brightenting" in the Ganymede data after that time.

But as you can see from the plots, the scatter with Europa and Ganymede is totally unacceptable and in fact all of this data as it is right now is totally useless.

However, the big hint is the fact that the quality of the photometry changes in relation to the target's distance to Jupiter.  IF this was just due to clouds, I'd expect the shapes of the plots to more or less be the same.  I see that to a certain extent, but there are other things going on that can only be due to the "instrumental effects", i.e., internal reflections (see images below in Figure 5), and the fact that Jupiter is such a huge blob.

Looking at the low-level "muck" in some of calibrated images, I see that yes indeed things are very dynamic:
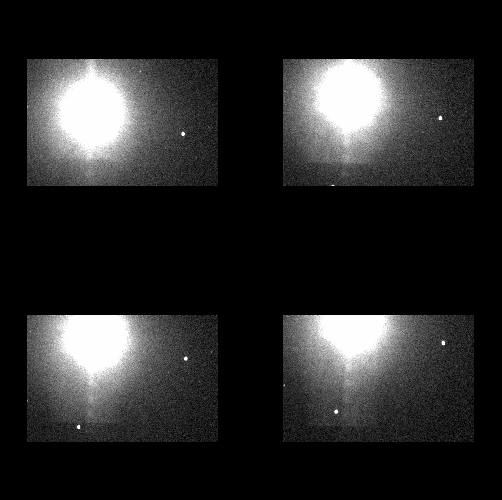
Figure 5: Calibrated Image Samples
Figure 5 is a sequence of four images taken as the targets scan across the field of view.  Jupiter is the bright spot.  You can also see Callisto (moving in from the bottom) and the background star (on the right).  Europa and Ganymede are hidden in the Jupiter blob.

It's obvious from these images that my photometric measurements are going to change dramatically over time, depending not only on where a single target falls, but also its proximity to Jupiter.

So I have two things to help me move forward and they both have equal priority.

First, model the PSF of Jupiter and subtract it out.  Depending on the quality of the fit, I should see a change (hopefully for the better) in the photometry for all four targets.

To test for consistent photometry, I've decided to take a series of at least 200 images of M35, which is near Jupiter but out of its photometric influence.  What I'm hoping to see is consistent photometry.  I certainly won't be lacking targets -- which will give my detection software a good workout, too.

The clouds have continued to inhabit the sky over my location, so no new data has been collected.

Frustrated, but still very enthusiastic and hopeful.

======= UPDATE =======

I decided to take a look at some of the images I got back on 13 Feb 2014 UTC when there weren't any clouds, and I now realize that I was dealing with more clouds than what I thought I was.

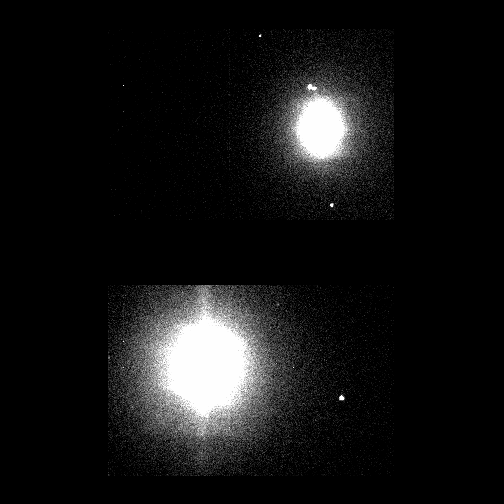
Below are two more figures, both showing the same raw images.  Figure 6 shows a raw image from 13 Feb 2014 UTC (top) and a raw image from 20 Feb 2014 UTC (bottom) with a certain level of contrast/brightness adjustment.  It's clear that the 13 Feb image is much sharper and as you can see Jupiter's light is leaking onto the satellites MUCH less.  Figure 7 shows the same two images, but I've adjusted the contrast/brightness to bring out the low-level muck.  As you can see, the two satellites above Jupiter in the top image (strangely almost the same distance and configuration as the 20 Feb satellites) are still visible while the bottom image shows them completely washed out.

So I'm pretty much worrying over nothing.  20 Feb 2014 UTC showed high clouds the entire time I was taking data and that's the explaination for the poor photometry results.

Having said that, I've located a Gaussian function maker in IRAF that will allow me to model the Jupiter PSF and subtract it out if necessary.
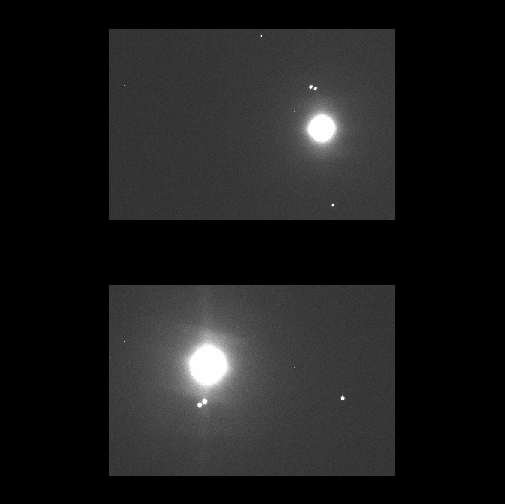
Figure 6: Raw data clear (top) and cloudy (bottom)

Figure 7: Same as Fig 6, brightness/contrast adjusted
So yes indeed there is still much hope for this project.  Now all I need is some clear sky!  Maybe tomorrow night if this new system stays to my south:


Friday, February 21, 2014

Cloudy Photometry First 200 Images

I've calibrated the first 200 images I took on the evening of 20 Feb 2014 UTC.  Unfortunately there were quite a few clouds, so the results aren't all that pretty.  Still, I'm encouraged by the results which I show and describe below.

Much of the time I've spent these past few days has been with the software.  Now that I have lots of data, I can no longer manually determine the approximate locations of the Jovian satellites to tell the photometry software I've written where to look.  So most of the programming I've been doing has been to automatically detect the locations of the satellites in each image.  No small task, but I knew that already.

Anyhow, what I've got now is a pretty robust program that does several things:

1. Locates the position of each Jovian satellite
2. Calculates the pixel distance from the satellite to Jupiter
3. Does square aperture photometry of the satellite
4. Detects cosmic ray events

At the moment, the accounting for all of this is still pretty messy as far as the output goes, so it's only really possible to see the results when plotted.  That will change once I'm able to figure out a way to say "that satellite is Europa and here are all the measurements".  This will come in time as I let the data teach me what I need to learn.

These first 200 images included quite a few clouds in the area, which shows up pretty clearly on the plots -- especially the photometry one.  The night got cleared as time went on, so I'm hopeful that the scatter with even the best of these gets smaller.  I'm still seeing about a 4% variation.

Ok, so here's the photometry plot.  The x-axis is the number of seconds after 0h UTC on 20 Feb 2014.  The y-axis is the count measured at the moment in ADU's (analog-to-digital units).
Figure 1: Photometry of Ganymede, Europa, Callisto
Yes, this is a messy plot.  But I hope you can see that as you scan from left to right there are three distinct groups.  Maybe the annotated plot below will help:

Figure 2: Annotated Figure 1
So the brightest satellite is Ganymede, next brightest is Europa, and the faintest is Callisto.  I hope that helps to make sense of this otherwise messy plot.

So as you can see, the scatter is pretty large and as I got to the end of this first set of 200 images, the clouds came in and totally destroyed the photometry which you can clearly see in the right third of the plot (from time 10700 through 11000).

As I said above, the best photometry I can see is the Europa photometry at time ~10150.  This is about a 4% scatter, which is still pretty terrible but considering the clouds I'm not too surprized.  I look forward to making similar plots of data later in the evening when the clouds moved out.

Here's a plot of the best Europa photometry.  Once again, the x-axis the time and the y-axis is the pixel count.  My impression is "not bad":

Figure 3: Best photometry of this first set of 200 images


The next three plots show the distance from satellite to Jupiter.  The x-axis is once again the relative time and the y-axis is the distance in pixels.

Here's Callisto slowly moving towards Jupiter:

Figure 4: Callisto Distance from Jupiter (in pixels)
Next is Europa moving towards Jupiter faster then Callisto (which is nice to see since Europa is closer to Jupiter and SHOULD have a faster orbital motion):

Figure 5: Europa Distance from Jupiter (in pixels)
And finally Ganymede moving away from Jupiter faster than Callisto but slower than Europa:

Figure 6: Ganymede Distance from Jupiter (in pixels)
So I'm still encouraged by all of these results, although I'm hopeful that the photometry gets better.  I really need as close to 1% scatter as I can get and if I'm not able to get that, I'll need to look and see if I can make any improvements or modifications to my calibration process.  If that fails, then I need to look at the hardware to try to determine why there's such a scatter.

Tomorrow I should be able to get through more of the data and make similar plots.

Thursday, February 20, 2014

Jupiter Moon Photometry 20 Feb 2014 UTC

Just a very quick note and picture about last night's observing session.  The clouds parted (well, mostly) and I got a pretty good couple of hours in.  I grabbed a total of 1357 raw images.  Some of those were flats, soe of those were darks, some of those were biases, some of those were binary stars.  But 1100 of them were Jupiter system images.  Because of the lack of tracking, I'd estimate that about 1/2 to 2/3 were images with the satellites in the FOV.

So the next task is the put the flats, darks, and biases together and start some data calibration.  Lotsa work!

Tonight looks like it's gonna be clear again, so I'll be back at it again for a couple of hours.

I was really pleased with the flat field technique I used.  I'll talk more about that in another post.  As for now, here's a picture from the end of the session.

The Jupiter system from last evening

Wednesday, February 19, 2014

Sun Observation Project

I've finally figured out how to access the raw (well, Level 1.5) image data from the SDO and I'm very excited about this.  I've been wanting to do "something" with the sun and the only way was to have access to the actual data rather than silly jpeg's and aminations.

I still have much to do, but I wanted to post some pictures of some image sequences of a "flash" or what I'm calling a "lightning bolt" that took place last night (local time for me) for a few minutes.  These are the kinds of things I'm interested in studying to get a feel for them and look for patterns of behavior.

The image frames you'll see below are all organized according to time, and they read from left to right, top to bottom.  There are sixteen images per frame three minutes apart, going from 02:00 UTC (upper left) to 02:45 UTC (lower right) on 19 Feb 2014.

There are a total of four frames here, representing four different wavelengths: 94A, 131A, 171A, and 1600A.  There are a total of nine different wavelengths but I limited this quick look to these four.  I want to make a plot of the intensity of this flash as a function of time for each wavelength, but I need to write some additional software to do this.  Today's task was to start understanding the kinds of scripts I need to create (actually, programs to write the scripts for me) in order to access the data and get it in a usable form.

Notice how the flash dims over time, but differently for each wavelength.

In any case, here are the image frames.  I've put some false coloring on them instead of leaving them grayscale to bring out some of the background features -- all of which are very interesting and changing in practically every image.

I will continue to look at all of this data.  There's a lot to look at and it's always being updated every three minutes!

One more thing, a 3 by 3 pixel area in these images corresponds to the size of the North America (24,709,000 km2).  These images are 1820 times that size!!!!!

Enjoy.
94A

131A

171A

1600A
All images courtesy of NASA/SDO and the AIA, EVE, and HMI science teams.

Tuesday, February 18, 2014

Under a Nice Blanket of Clouds

An astronomer's nemasis:
I'm somewhere underneath these clouds
But the great thing is that I'm clear-sky limited not telescope time limited.  The "professionals" have nothing on me!

Clear skies are on the way, however.  Tomorrow night is suppose to be clear and windy.  Ah well, at least it's been an unusually warm winter.

Hopefully at that time I'll be able to try out my flat field technique and get images of some binary stars so I can measure my pixel scale.  If the photometry is good enough (which I expect it will be) I'll also be imaging the Jupiter system.

Here's how it's supposed to look 24h from now:

The Jupiter system on 20 Feb 2014 at 03:26 UTC
So it looks like more Callisto stuff for sure.  Europa and Ganymede might be too close for good photometric separation.  Io is transiting and will therefore be invisible.

Stay tuned!