Independent Research Astronomer and Space Musician
Come with me and re-discover the universe!
More info via links on the right.
Wednesday, November 5, 2025
Lunar Anomalies #2
Top 225 sections that are 'not the moon'. Highest is at top left, and then moves right and down. This is from the LRO dataset M1502045101LC, and is my section 'c'. These are 64 by 64 pixel sections, which work out to be about 50 meters by 50 meters.
Wednesday, October 29, 2025
Lunar Anomalies #1
Are there objects or patterns on the Moon that don't look like they should be there, or have some other unusual characteristics? If there are, what are they?
I've started a project that is searching for anomalies on the Moon.
An ‘anomaly’ is something that isn’t ‘like the Moon’.
Here’s a description of the process I've developed:
I start with a CDR (Calibrated Data Records) image from LRO (Lunar Reconnaissance Orbiter) downloaded from https://pds.lroc.im-ldi.com/data/. I’m using the ones that are 5064x52224 pixels. I divide this images up into eight, 5064x6528 sections and call them a, b, c, d, e, f, g, and h.
To generate training data for an autoencoder, I take a section and I randomly select 7,575 64x64 subarrays. I train on these and generate a model of ‘the typical moon’ for that particular image section.
Here’s a typical image section showing the location of 200 (of the 7575) random sample locations:
It looks like it’s a pretty decent random distribution.
I then divide the image up into 7,575 64x64 images systematically (i.e., in a grid that samples the entire image). Each of these is fed into the autoencoder model, and each gets a ‘score’ based on the MSE (mean-squared error) of the output of the model.
I then sort these according to MSE value. The lower the MSE, the more similar to the trained model it is (and “more like” the Moon it is). The higher the MSE, the less similar to the model it is (and more unlike the Moon it is).
Judging from the sorted MSE curves, I’ve decided that the top 225 sections (i.e., the sections with the highest MSE values) are the ones I should pay most attention to when it comes to finding anomalies.
In the end of this process, I generate a sorted (highest to lowest) MSE list of subarrays. Note these plots are log scale on the y-axis:
I take the top 225 of them and generate a visual display of each subarray (upper left has the highest MSE, lower ones proceed left to right to the bottom right) :
Here's where these 225 subarrays are located in the full image section:
As expected, many of these mark the locations of craters and/or rock outcroppings, which the autoencoder has deemed to be "not like the moon" (a high MSE):
Sofar in the very small amount of data I've examined (there are literally petabytes of LRO data, so I'll never get through it all), I've already found a few interesting things:
Tuesday, October 21, 2025
Non-Astronomy Projects
I'm going to start posting all of my non-astronomical projects to my other blog:
Thursday, May 1, 2025
Accelerometer Spectrogram
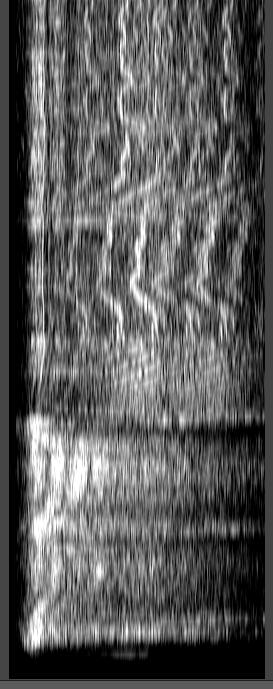
I can't fit the whole thing without making it hard to see, but this is a spectrum of the first ~516 seconds of my latest ride on my ebike. The data is from the accelerometer on a smartphone, measuring x, y, z, and total g-force. The plot above goes from 0Hz (left) to 100 Hz (right), and time goes from bottom to top.
The first third shown here is when I'm on a dirt road, and then the remaining 2/3 is on paved highway. These are very complex spectra and I have no idea how to properly interpret them. The harmonics are pretty amazing!
Wednesday, February 19, 2025
Thursday, February 13, 2025
Labeled Data Sets Update
I think I'm pretty happy with the layout of each dataset entry:
Each entry shows the title of the dataset, a short description, a few sample images, information content plots for the Hue, Saturation, and Value components of each image, and a focus score (the higher it is the sharper the focus). Then a little more info about number of images, image dimensions, tarfile size, labels, and price. Customers click on which dataset(s) they want, submit an order, and get their data when payment is confirmed.
Now I'm on the task of trying to automate the whole process to make adding new entries as easy as possible. Pretty sure I can, but it might take a few more manual runs to narrow it down. Very likely not every step can be automated (yet), but where I can I will.
Still not sure what an appropriate threshold number of entries will be needed to make this site live. More than two, for sure. Ideally I think I'd like to start with 100, but doing all of those manually would be a monumental and tedious task, which of course if why I'm trying to automate it as much as possible. Maybe 100 will be easy. There's certainly enough data to be collected.
Monday, February 10, 2025
Universal Basic Income / Income Supplementation
Any form of Universal Basic Income (UBI) is free money. Under the current circumstances and unless you have price controls (thus ends any form of free-market capitalism), implementation of UBI will inflate prices until we're back to where we are now with no one being able to afford anything. Increase the UBI amounts, and the prices will automatically follow. Even the experts don't seem to have a solution to this -- they're stuck on the idea that 'work' is the only thing that carries any value, and when there is no work there is no income. There is, however, a beautiful solution.
Data Harvesting
(no, not internet scraping)
Do the work you want to (if any), and get paid for the data you harvest ...
... and this is only one side of the coin. The other side is the recipient of that data, the entities that pay you, and the entities that you buy things from.
My apologies for being a little cryptic, but since no one will ever see this, my intent is to simply have a record of my top-level thoughts without spending too much time and effort going into detail.
I do have a lot of this worked out. More soon (maybe) ....
Subscribe to:
Posts (Atom)